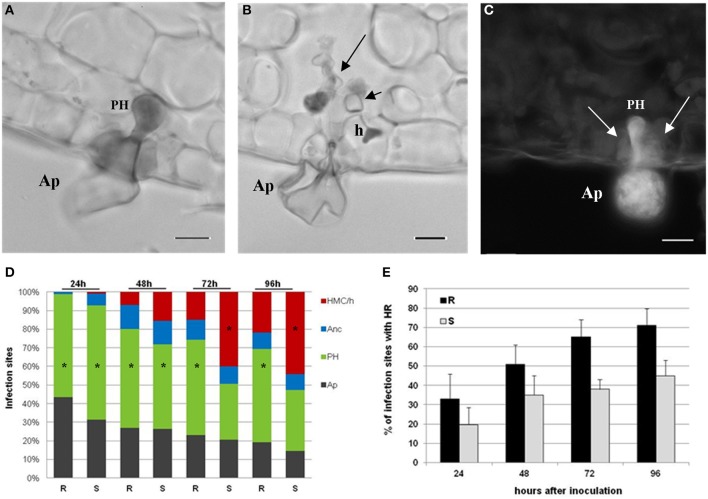
Figure 1.
Light micrographs of H. vastatrix infection sites at 72 hai. (A) Appressorium (Ap) over the stomata and a penetration hypha (PH) in the resistant sample leaves, stained with cotton blue lactophenol. (B) Ap and intercellular hyphae (large arrow) in the susceptible sample leaves, stained with cotton blue lactophenol, being visible an haustorial mother cell (HMC) (small arrow) with a haustorium (h) in the stomatal subsidiary cell. (C) Autofluorescence, by blue light epifluorescence test, of guard cells (arrows) associated with a PH in the resistant sample leaves. Note that the fungal structures are also autofluorescent. (bars = 10 μm). (D) Percentage of infection sites with different fungal growth stages (Ap, PH, anchor - Anc, and HMC/h) in resistant (R) and susceptible (S) sample leaves at 24, 48, 72, and 96 hai. * = mode value. The weighted averages of the different fungal growth stages (Ap, PH, Anc, and HMC/h) were significantly higher in the S than in the R sample leaves at 24 hai (t = 4.08; P ≤ 0.001), 48 hai (t = 4.47; P ≤ 0.001), 72 hai (t = 6.77; P ≤ 0.001) and 96 hai (t = 6.91; P ≤ 0.001). (E) Percentage of infection sites with autofluorescent and/or browning cells (HR-like cell death) in R and S leaves, at 24, 48, 72, and 96 hai. The average percentages were significantly higher in the R than in the S leaves, at 24 hai (t = 3.71; P ≤ 0.001), 48 hai (t = 5.49; P ≤ 0.001), 72 hai (t = 12.40; P ≤ 0.001), and 96 hai (t = 8.83; P ≤ 0.001).

