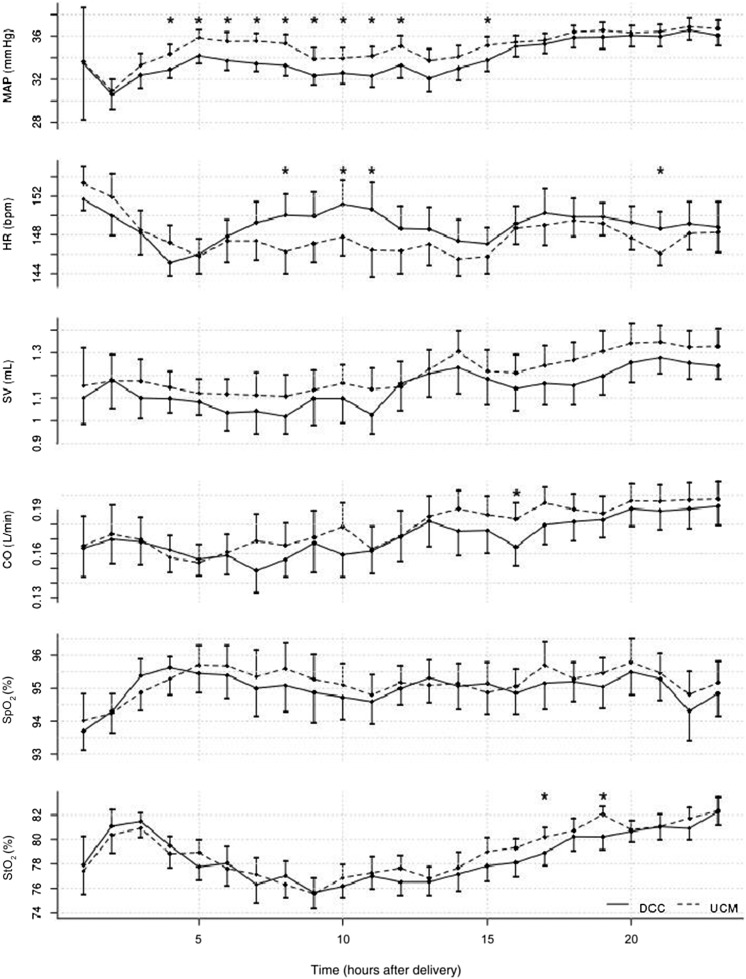
FIGURE 2.
Continuous hemodynamic measurements over 24 hours of life. Dotted line, UCM; solid line, DCC; CO, cardiac output by electrical cardiometry; HR, heart rate; MAP, mean arterial pressure; Spo2, pulse oxygen saturation; SV, stroke volume by electrical cardiometry; Sto2, cerebral saturations by near-infrared spectroscopy. *Paired t test = P < .05 for hourly averages. MAP was significantly higher in UCM infants treated with UCM for the first 15 hours (HR 3–15 beats per minute; χ2 = 5.05, P = .02).

