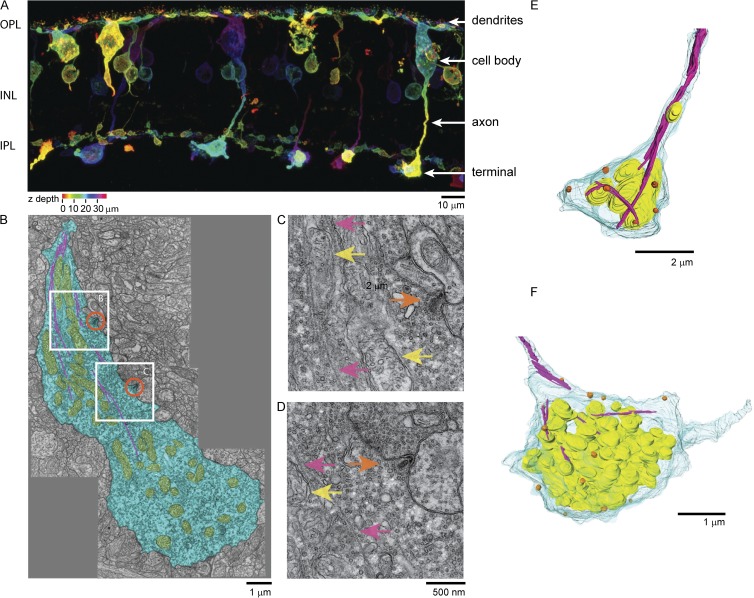
Figure 4.
Subcellular structure of bipolar terminal imaged in intact retinal tissue slices. (A) PKC staining of cells in the outer plexiform layer (OPL), in the inner nuclear layer (INL), and in the inner plexiform layer (IPL) of the retina. Color code represents Z-height through the slice. (B) TEM image of a slice of the IPL of the goldfish retina. A single bipolar terminal (blue) contains an extensive network of mitochondria (yellow) and microtubules (magenta). Orange circles indicate two ribbon locations. (C) Magnified view of upper white box region shown in B. Orange arrows indicate ribbons. Magenta arrows indicate microtubules. Yellow arrows indicate mitochondria. (D) Magnified view of lower white box region shown in B. (E and F) 3-D reconstruction of 3-D serial block-face electron microscopy imaging of single bipolar terminal in the IPL. Blue, plasma membrane; yellow, mitochondria; orange, ribbons; magenta, microtubules.

