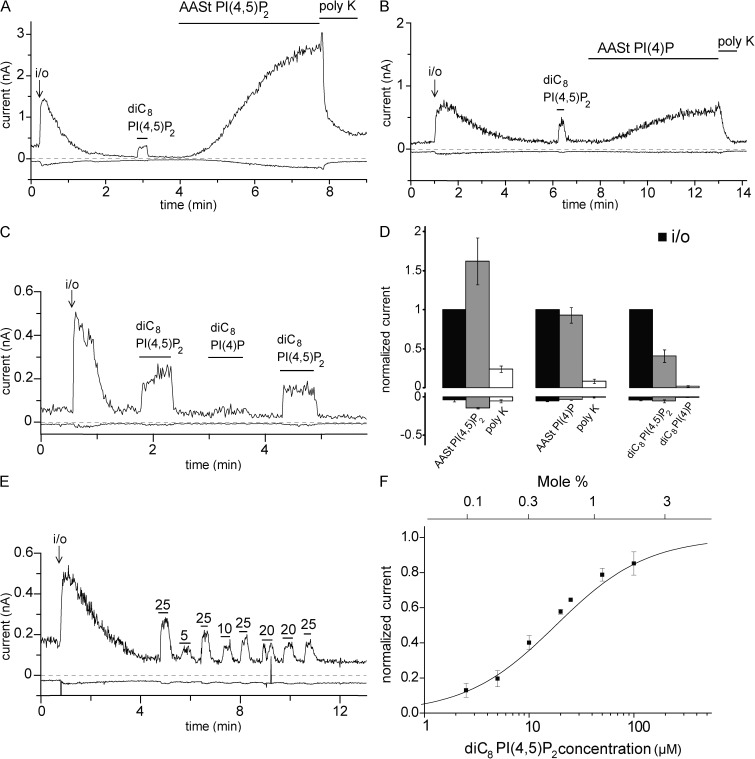
Figure 1.
PI(4,5)P2 reactivates hTRPM3 in excised inside-out patches after rundown. (A–C) Representative traces at 100 and −100 mV; experiments were performed on hTRPM3-expressing Xenopus oocytes with 100 µM PregS in the patch pipette as described in Materials and methods. The measurements start in the cell-attached mode; the establishment of the inside-out configuration (i/o) is indicated with an arrow. The applications of 25 µM diC8 PI(4,5)P2, 10 µM AASt PI(4,5)P2, 10 µM AASt PI(4)P, 30 µg/ml Poly-Lys (poly K), and 25 µM diC8 PI(4)P are indicated with the horizontal lines. (D) Statistical summary; the data are normalized to the TRPM3 current immediately after the establishment of the inside-out configuration at 100 mV (n = 6–7). (E) Representative trace showing the effects of different concentrations (µM) of diC8 PI(4,5)P2 applied to an excised inside-out patch; 25 µM diC8 PI(4,5)P2 was applied repetitively to normalize the effect of other concentrations and control for any time-dependent decrease in the responsiveness of TRPM3. (F) Summary of the dose–response relationship of diC8 PI(4,5)P2 (n = 4–10 for the individual concentrations), EC50 = 18.01 µM. Current values were initially normalized to the effect of the repetitively applied 25 µM diC8 PI(4,5)P2 and then renormalized for plotting to the maximal value obtained by the curve fitting. The top horizontal axis shows the mole percentage corresponding to the diC8 PI(4,5)P2 concentrations calculated using the formula from Collins and Gordon (2013). Error bars represent SEM.

