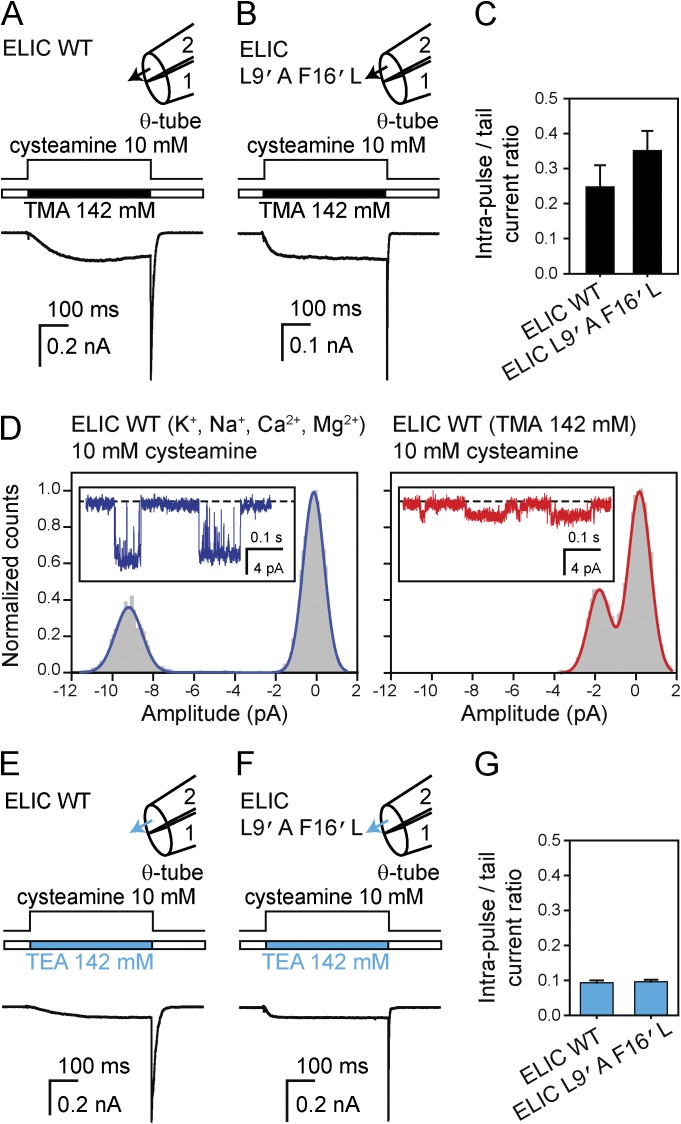
Figure 12.
TMA+ and TEA+ conduction through ELIC. (A and B) Macroscopic current responses to 500-ms pulses of 10 mM cysteamine plus 142 mM TMA+ recorded at –80 mV from the wild type (A) and the L9′A + F16′L wider-pore mutant (B) in the outside-out configuration. The TMA+-containing solution was (in mM) 142 TMACl, 10 cysteamine, and 10 HEPES/TMAOH, pH 7.4, whereas the TMA+-free solution was (in mM) 142 KCl, 5.4 NaCl, 1.8 CaCl2, 1.7 MgCl2, and 10 HEPES/KOH, pH 7.4. In the schematic representations of the theta-tubing perfusion, arrows indicate the application of TMA+. (C) Intra–pulse-to-tail current ratios. The plotted values are means obtained from 5 (wild type) and 6 (L9′A + F16′L mutant) patches; error bars are the corresponding standard errors. (D) Single-channel inward currents elicited by 10 mM cysteamine recorded at –80 mV in the outside-out configuration (openings are downward deflections) and corresponding all-point amplitude histograms. For the panel on the left, the external solution was (in mM) 142 KCl, 5.4 NaCl, 1.8 CaCl2, 1.7 MgCl2, 10 cysteamine, and 10 HEPES/KOH, pH 7.4, whereas for the panel on the right, this solution was (in mM) 142 TMACl, 10 cysteamine, and 10 HEPES/TMAOH, pH 7.4. (E–G) Macroscopic current responses and intra–pulse-to-tail current ratios. All conditions are as in (A–C), replacing TMA+ with TEA+. The values plotted in G are means obtained from 9 (wild type) and 7 (L9′A + F16′L mutant) patches; error bars are the corresponding standard errors. All macroscopic current traces shown in this figure are the averages of 10 consecutive responses recorded from representative patches.

