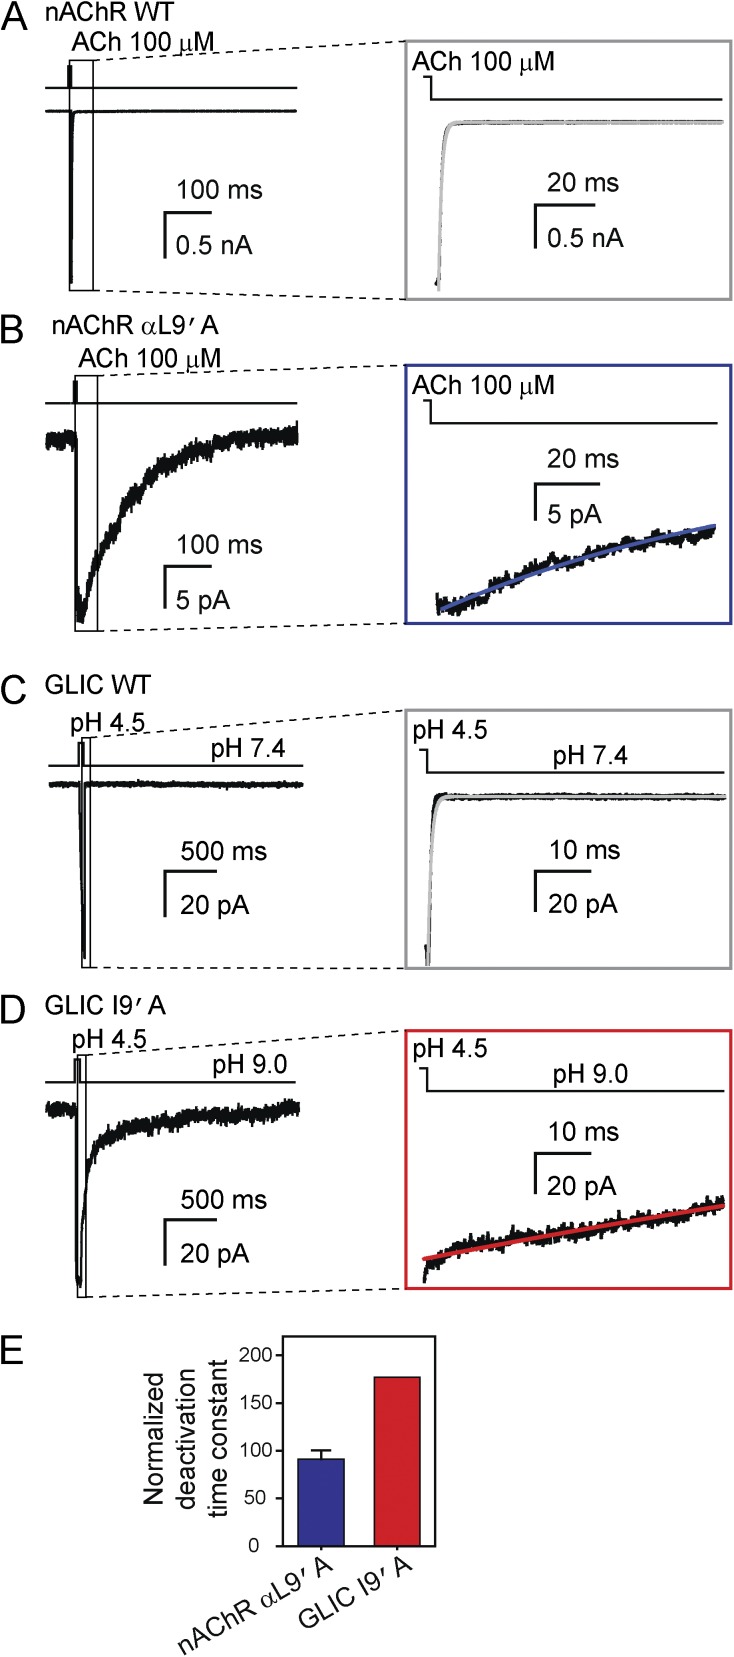
Figure 15.
Effect of mutations at position 9′ of M2 on deactivation of the muscle nAChR and GLIC. (A and B) Macroscopic current responses to 1-ms pulses of 100-µM ACh recorded at –80 mV from the wild-type mouse muscle adult-type nAChR (A) and the αL9′A mutant (B) in the outside-out configuration. The solutions flowing through the two barrels of the perfusion tubing were (in mM) 142 KCl, 5.4 NaCl, 1.8 CaCl2, 1.7 MgCl2, and 10 HEPES/KOH, pH 7.4, with or without ACh. (C and D) Macroscopic current responses to 50-ms pulses of pH-4.5 solution recorded at –80 mV from wild-type GLIC (C) and the I9′A mutant (D) in the outside-out configuration. The solutions flowing through the two barrels of the perfusion tubing were (in mM) 142 KCl, 5.4 NaCl, 1.8 CaCl2, 1.7 MgCl2, and the pH was buffered with 10 HEPES/KOH (pH 7.4), 10 TABS/KOH (pH 9.0) or 10 acetic-acid/KOH (pH 4.5). In the case of the gain-of-function I9′A mutant, the (proton-gated) activity of the channel at pH 7.4 was relatively high, and hence, the pH of the solution applied during the “no-agonist” intervals was increased to 9.0. For all panels, the insets emphasize the time courses of deactivation; lines are fits to monoexponential-decay functions. (E) Mutant-construct deactivation time constants obtained from monoexponential fits normalized to the corresponding wild-type time constants. The plotted values are means obtained from 4 (L9′A nAChR) and 2 (I9′A GLIC) patches. An error bar (standard error) is only displayed for the nAChR; for GLIC, the two averaged values were 155 ms and 169 ms. All current traces shown in this figure are the averages of 10–25 consecutive responses recorded from representative patches.

