Figure 2.
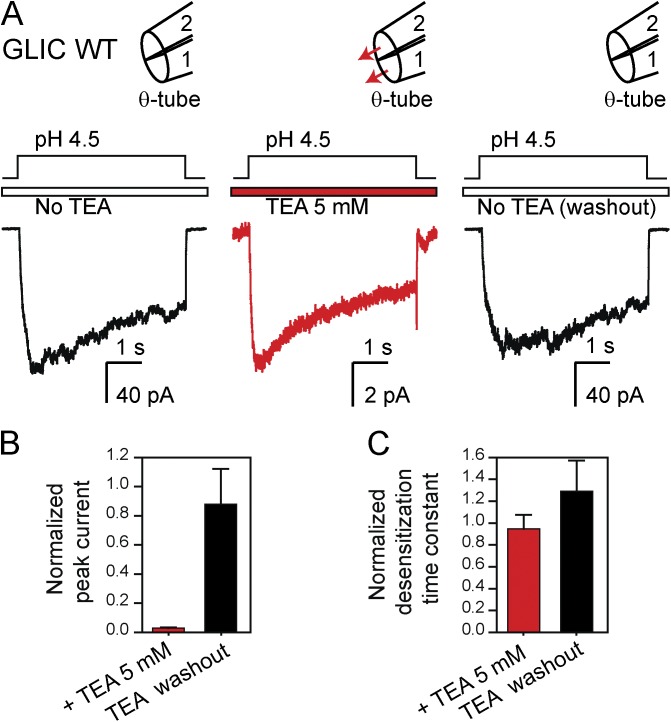
Block of GLIC by TEA+. (A) Macroscopic current responses to 5-s pulses of pH 4.5 solution (pHholding 7.4) recorded at –80 mV in the outside-out configuration. The response of each patch of membrane was recorded sequentially in the absence of TEA+ (left), in the presence of 5 mM TEA+ flowing through both barrels of the theta-type perfusion tubing (middle), and back again, without TEA+ in either barrel (right). The solutions flowing through the two barrels of the perfusion tubing were (in mM) 142 KCl, 5.4 NaCl, 1.8 CaCl2, 1.7 MgCl2 with or without TEA+, and pH buffered with 10 mM HEPES/KOH, pH 7.4, or with 10 mM acetic acid/KOH, pH 4.5. In the schematic representations of the theta-tubing perfusion, arrows indicate the application of TEA+. Note the expanded current scale used for the middle panel; the trace is the average of 25 consecutive responses recorded from a representative patch. (B) Peak-current amplitudes recorded in response to the application of pH 4.5 in the presence of external 5 mM TEA+ and upon TEA+ removal normalized to the peak value observed in the initial TEA+-free recording. (C) Time constants of desensitization during the application of pH 4.5 in the presence of external 5 mM TEA+ and upon TEA+ removal normalized to the time constant fitted to the initial TEA+-free recording. The values plotted in B and C are means obtained from 6 patches; error bars are the corresponding standard errors.

