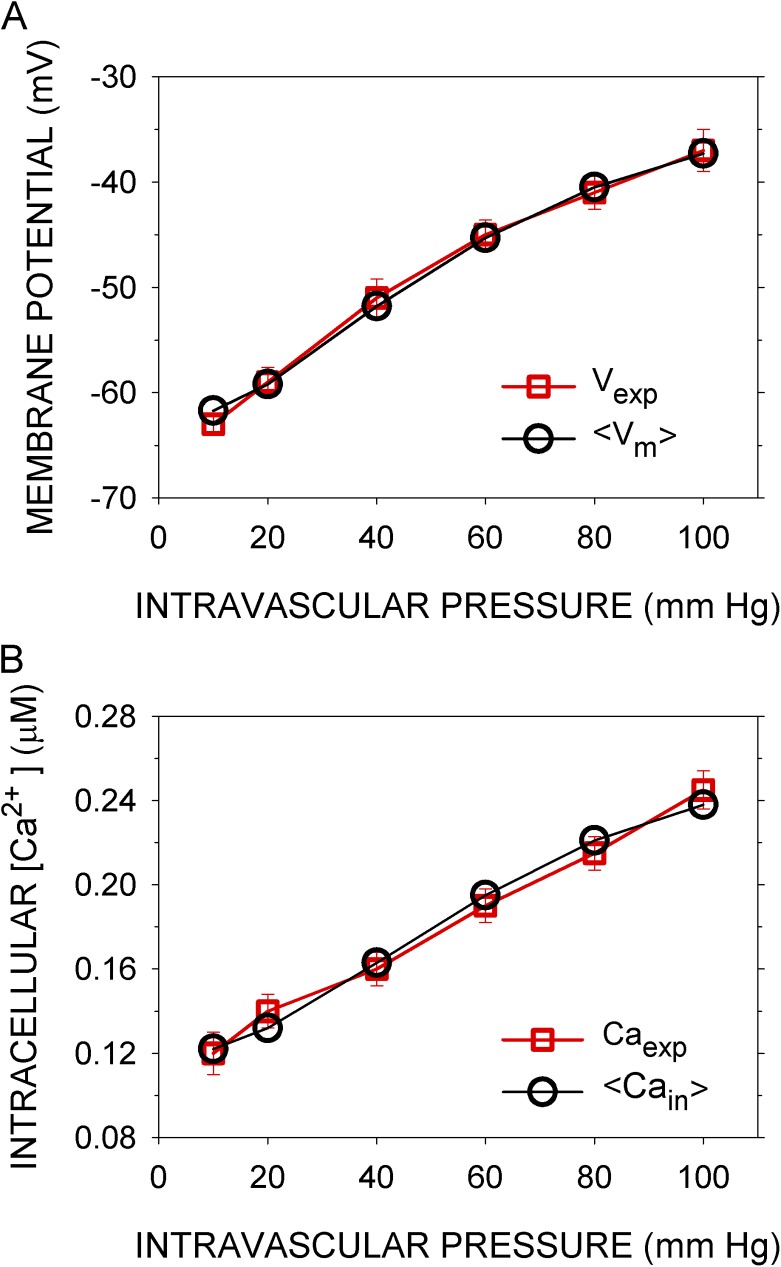
Figure 2.
Simulated and experimental Vm and sarcoplasmic Ca concentration as functions of intramural pressure. (A) Vexp (red squares) are the means over 30 s of the observed Vms after steady-state responses to the indicated intramural pressures were reached, recorded in rat cerebral arteries (Knot and Nelson, 1998). <Vm> (black circles) are the means of Vm over the last 50 s of a 300-s simulation with the normal parameter set (Table S6). In the simulations, the indicated intramural pressures were applied starting at 10 s. (B) Caexp (red squares) are the mean Ca concentrations recorded under the conditions in A, and <Cain> (black circles) are the means of Cain calculated as in A. Error bars represent standard deviations of the experimental data.

