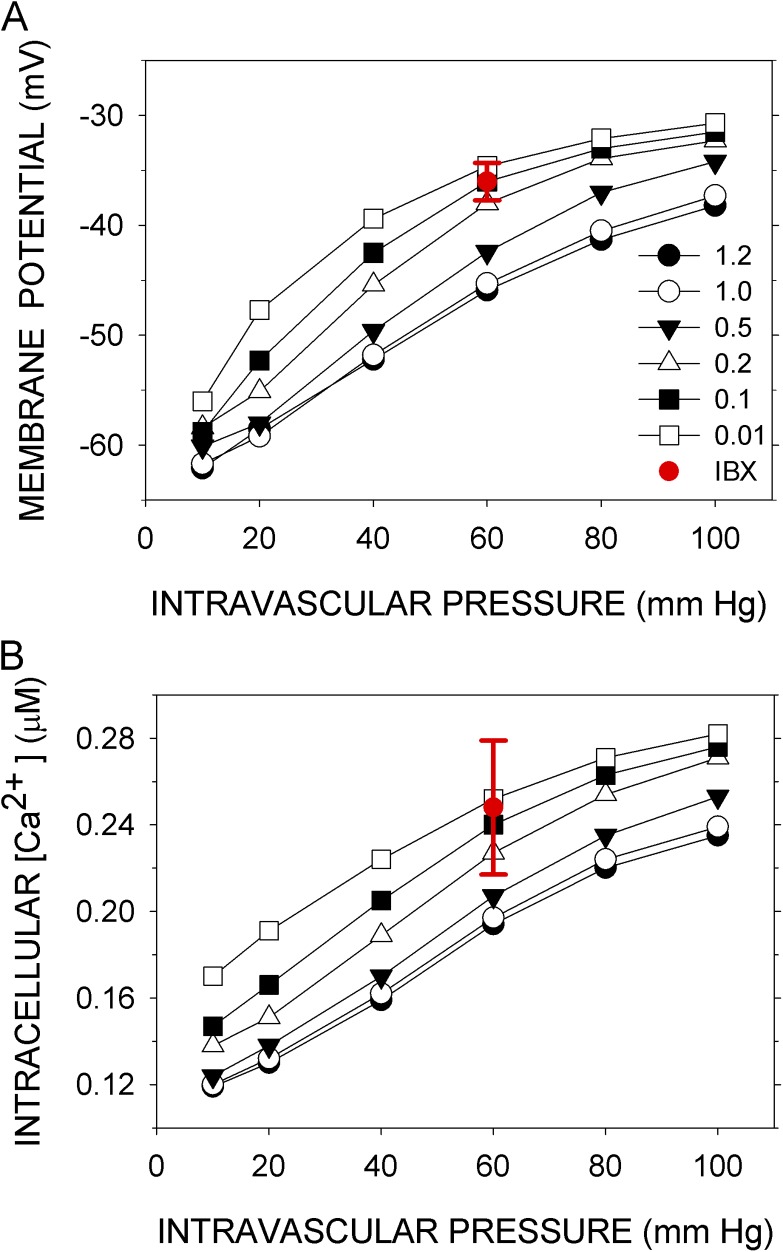
Figure 3.
Simulation of the effects of inhibiting BK. (A) Vexp and (B) Caexp (red circles with error bars) were recorded at 60 mm Hg in the presence of 100 nM iberiotoxin (Knot et al., 1998). Vm and Cain were simulated with the number of BK molecules (BKT) set at the indicated multiples (1–120%) of its normal value. <Vm> and <Cain> are the means over the last 50 s of a 300-s simulation (black symbols). Except for BKT, the parameters were normal. Error bars represent standard deviations of the experimental data.

