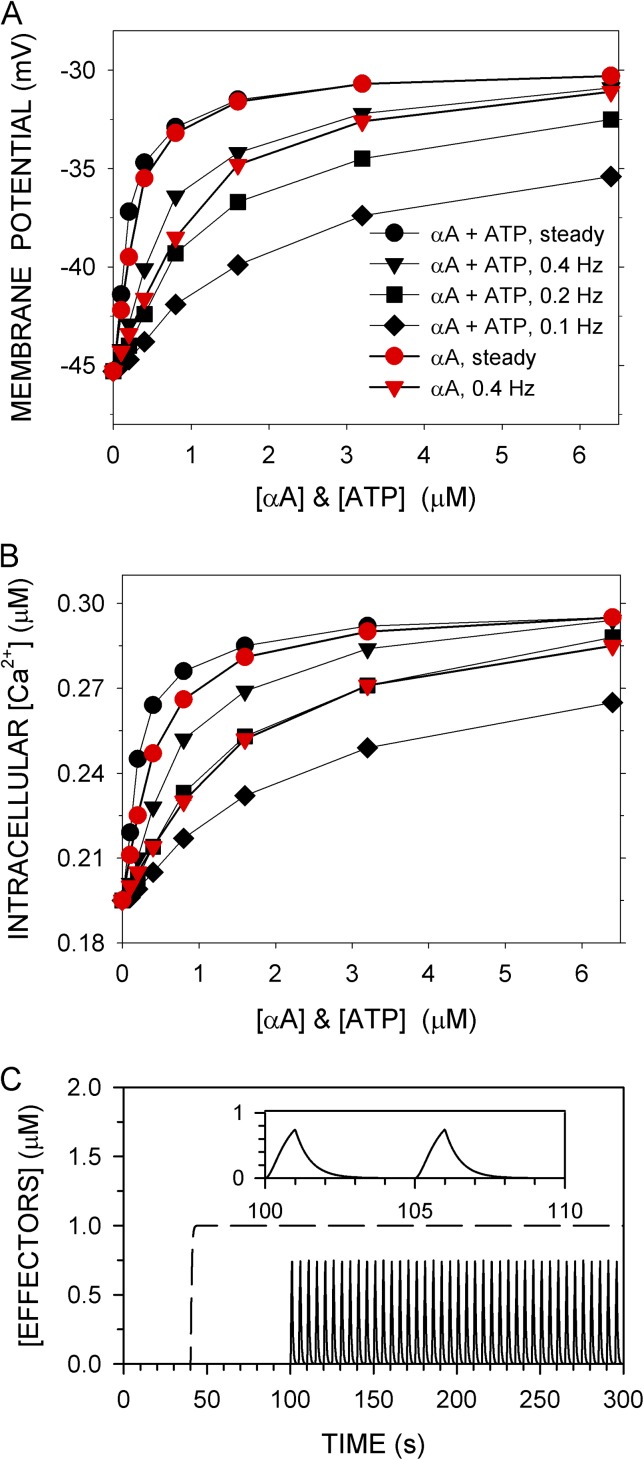
Figure 6.
Effects of α-adreneric agonist (αA) and ATP on <Vm> and <Cain> at 60 mm Hg. (A) <Vm> and (B) <Cain> are the means over the last 50 s of a 300-s simulation computed with normal parameters. αA alone (red symbols) or αA and ATP together at the same concentration (black symbols) were added either steadily from t = 40–300 s (C; dashed line) or in pulses from t = 100–300 s (C; solid line). Pulses were on for 1 s and were off for 1.5 s (0.4 Hz), 4 s (0.2 Hz), or 9 s (0.1 Hz). The rate constant for both the rise and fall of a pulse was 2/s. (C) Nominally 1-µM pulses at 0.2 Hz and (inset) two cycles on expanded scale (solid line) are shown, at a steady application of 1 µM (dashed line).

