
Figure 3.
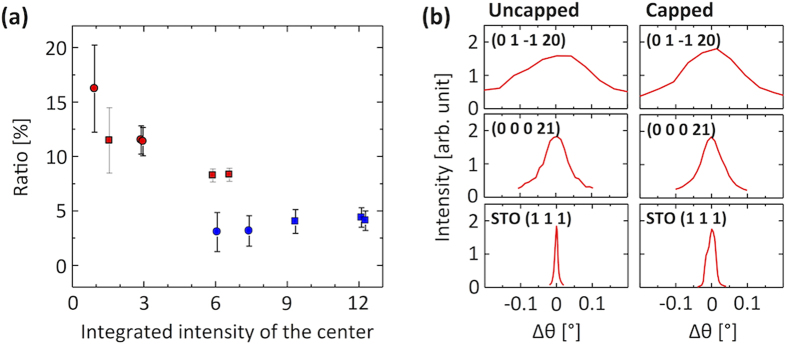
(a) The intensity ratio of the satellites to the main peak. Red circles and squares represent the uncapped sample and blue ones the capped film. Circles and squares represent different twin domains. The intensities have been obtained by fitting Lorentzian lineshapes assuming symmetric satellite peaks i.e. both have same height, width, and tilt angle. We also assume the peak widths and the distance between the main and satellite peaks are the same for all the peaks belonging to the same domains where the {0 1 –1 20} reflection appears every 120°. (b) Rocking curves of STO (1 1 1) and CBST (0 0 0 21) and (0 1 –1 20) reflections. Note that the widths are similar for both films regardless of the crystalline quality of the STO substrate.