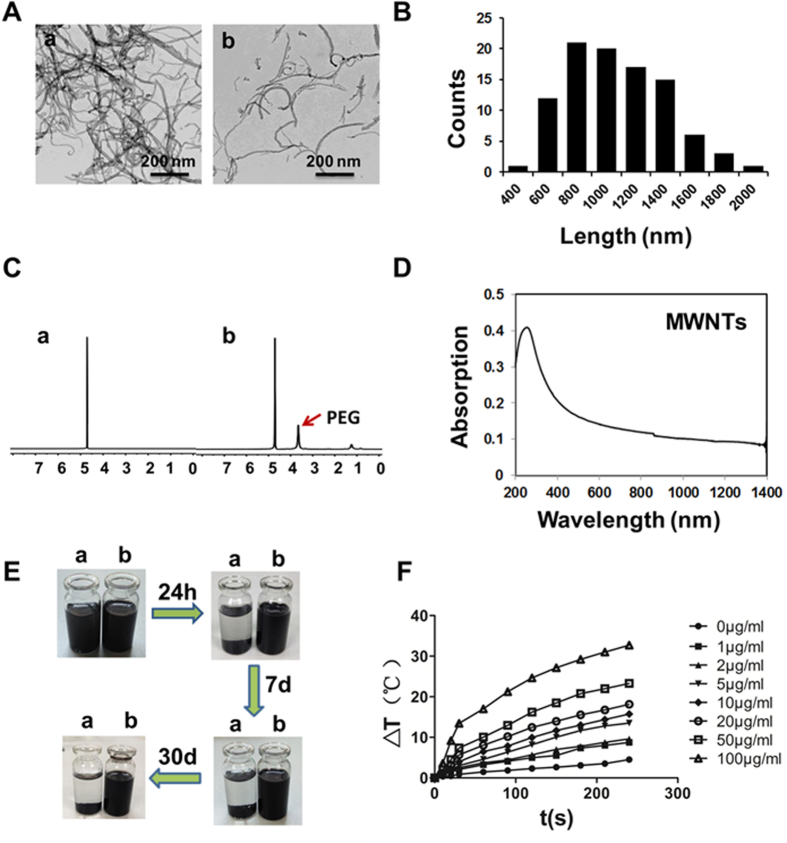
Figure 1. Characterization of MWNTs.
(A) TEM images showed raw MWNTs (a) were aggregated in thick cords PBS at room temperature while PEGylated MWNTs (b) were mostly dissolved in the solution. Scale bars = 200 nm. (B) Histogram showing the size distribution of MWNTs obtained from TEM images. (C) The 1H NMR spectra of raw MWNTs (a) only showed the solvent residual peak while PEGylated MWNTs (b) showed PEG resonance peak and the solvent residual peak, indicating successful synthesis of PEGylated MWNTs. (D) Optical absorption measurement showed MWNTs had a high absorbance at a region of 700–1,100 nm. (E) The stability test of raw MWNTs (a) and PEGylated MWNTs (b) in PBS showed raw MWNTs gravitated to the bottom of the bottle after 24 h, but PEGylated MWNTs were stable even up to 30 days. (F) Evaluation of temperatures of MWNTs solutions clearly showed that the temperatures rose with the period of NIR irradiation (0–240 s) and also with the concentration of MWNTs (0–100 μg/ml) (n = 3).

