. 2015 Jun 8;45(3):101–110. doi: 10.5051/jpis.2015.45.3.101

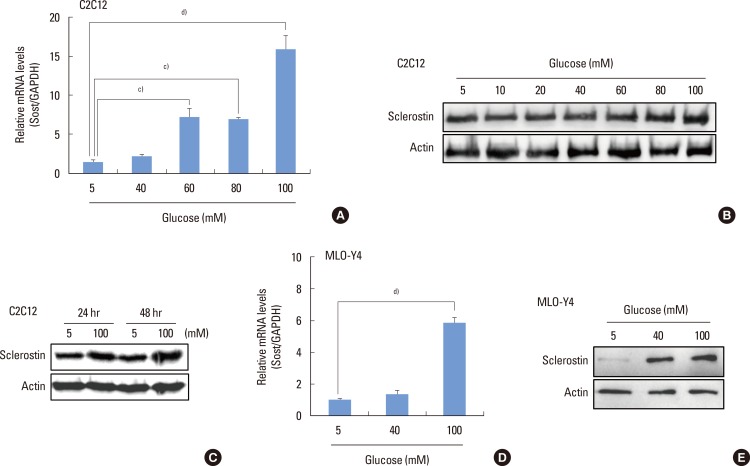
Figure 1. High glucose increases sclerostin expression. (A-C) C2C12 cells were cultured in osteogenic medium in the presence or absence of high glucose for 48 hours (h) unless specified, and (A) RT-PCR and (B) Western blot analysis were performed. (D, E) MLO-Y4 cells were incubated for 48 hours in the presence or absence of high glucose treatment, followed by (D) quantitative RT-PCR and (E) Western blot analysis. The graphs (A, D) indicate the mean±standard deviation of the triplicate samples (c)P<0.001, d)P<0.0001). GAPDH, glyceraldehyde 3-phosphate dehydrogenase; RT-PCR, reverse transcription-polymerase chain reaction. In the Figure 1C, 5 and 100 mM indicate the concentration of glucose in the culture medium.

Figure 1