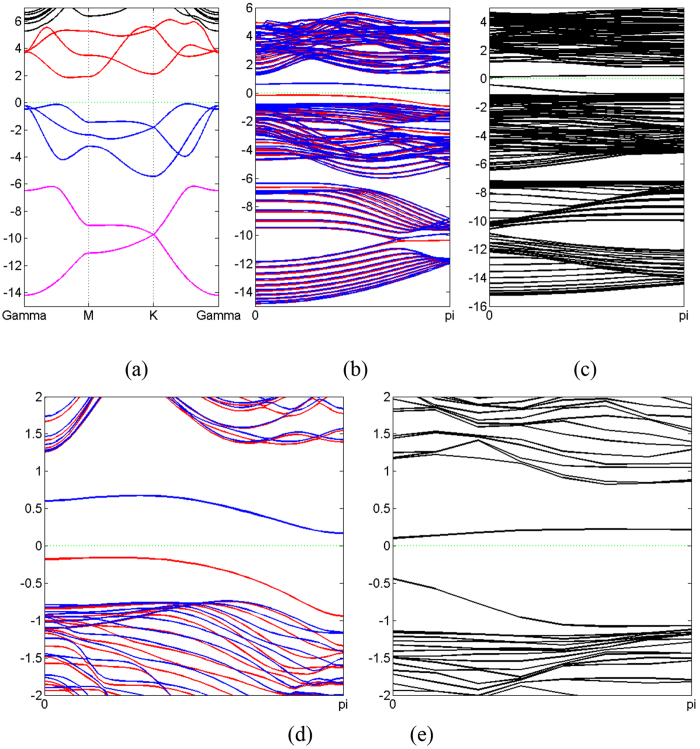
Figure 8.
Band structure of zigzag blue phosphorus ZNR (b) and ANR (c) compared with that of monolayer (a). (d) and (e) Same as (b) and (c) but the energy scale is different. The Fermi level is denoted by green dash line. Red and blue solid lines in (b) and (d) refer to spin-up and spin-down, respectively.

