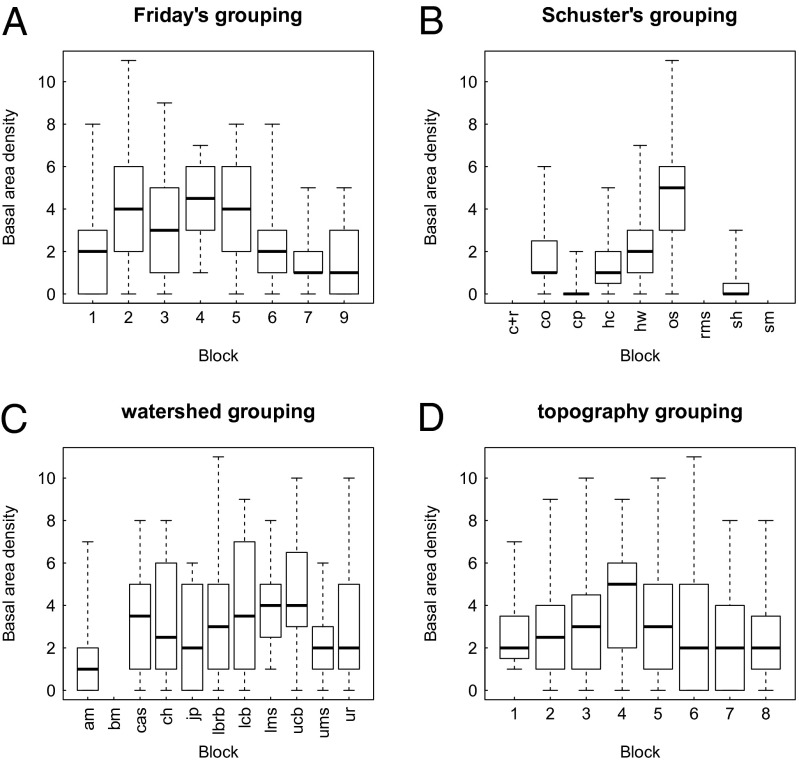
Fig. 3.
Boxplots of basal area density of RO in BRF, according to four biological methods of assigning plots to blocks. In each boxplot, the median is the bold black bar, the box covers the interquartile range, and the whiskers cover the entire range of basal area density within a block. One-way unbalanced ANOVA tests of the null hypothesis of no difference between blocks in mean basal area density rejected the null hypothesis (P < 0.05) for all grouping methods except for the topography grouping. (A) Friday’s grouping. (B) Schuster’s grouping. (C) Watershed grouping. (D) Topography grouping.

