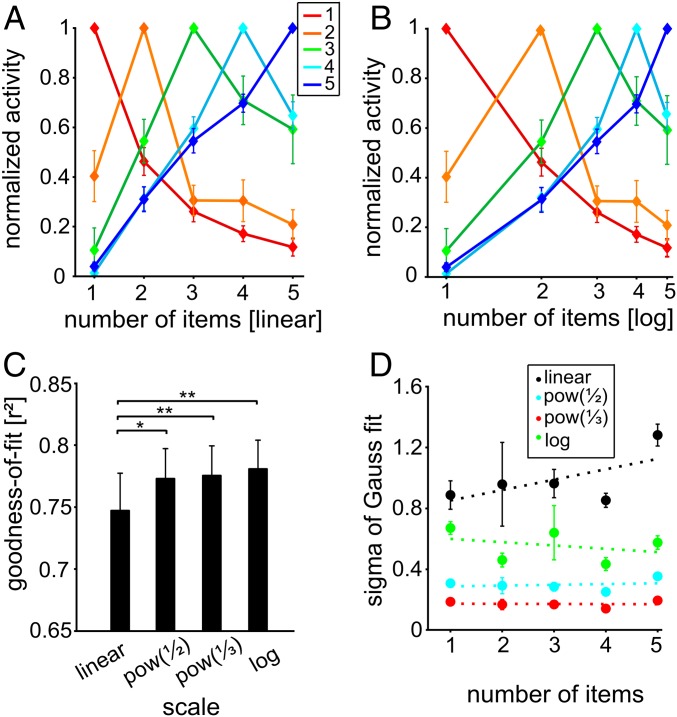
Fig. 3.
Neuronal representation of numerosities in the NCL during the sample period. (A and B) Normalized tuning functions averaged for neurons preferring the same numerosity (indicated by same color) when plotted on a linear number scale (A) or on a logarithmic number scale (B). (C) Goodness-of-fit for the four different scaling schemes. (D) SD values for the scaling schemes across preferred numerosities (error bars ± SEM).

