
Fig. 1.
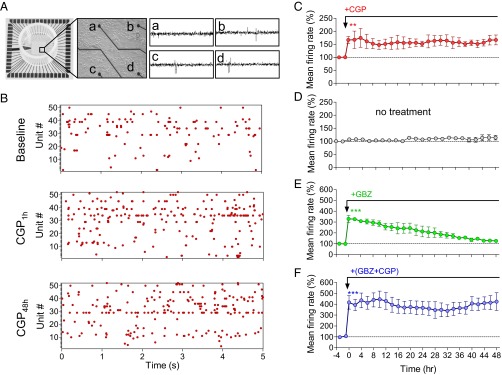
GABABR blockade disrupts firing rate homeostasis in hippocampal networks. (A, Left) Image of MEA dish. (Middle) Image of dissociated hippocampal culture plated on MEA. Black circles at the end of the black lines are the recording electrodes. (Right) Representative traces of recording from four MEA channels (a, b, c, and d). (B) Representative raster plot of MEA recording before and 1 and 48 h after application of the GABABR antagonist CGP (1 μM). (C–F) Mean firing rate of hippocampal neuronal cultures incubated with CGP (n = 4; C), no treatment (Cnt, n = 6; D), gabazine (GBZ, 30 μM, n = 4; E), and CGP+GBZ (n = 4; F) during 2 d of MEA recordings.