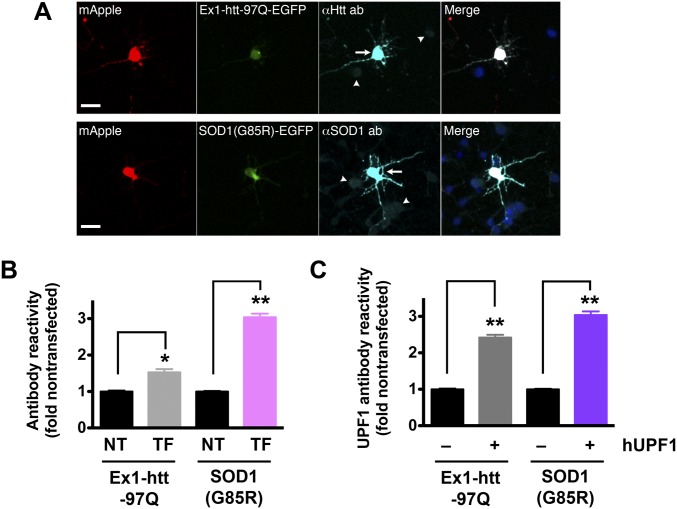
Fig. S3.
Quantitative immunocytochemistry of mutant htt and SOD1 in transfected neurons. (A) Primary cortical neurons were dissected, cultured, then transfected with mApple and either mutant htt (Ex1-htt-97Q) or SOD1(G85R) fused to EGFP. Transfected proteins were visualized by immunocytochemistry using antibodies that recognize both endogenous (arrowheads) and exogenous (arrows) htt or SOD1. (Scale bars, 25 µm.) (B) Fold overexpression of htt or SOD1 was calculated by comparing antibody reactivity in nontransfected cells (NT) to that in transfected neurons (TF). htt, 161 neurons each for NT and TF groups; SOD1, 146 neurons each for NT and TF groups. (C) Quantitative immunocytochemistry with antibodies against UPF1 was used to determine the UPF1 level in untransfected (−) cells and those transfected (+) with hUPF1. Ex1-htt-97Q, n = 124 neurons each for (−) and (+) groups; SOD1(G85R), n = 148 neurons each for (−) and (+) groups. In B and C, *P < 0.001, **P < 0.0001, vs. NT by two-tailed t test. Data were pooled from four experiments. Error bars represent ± SEM.

