Fig. 3.
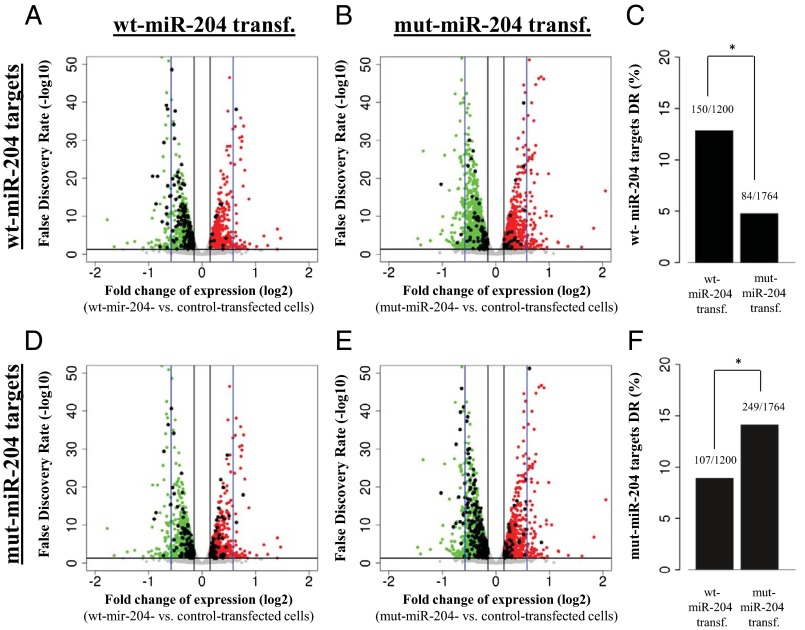
The n.37C > T sequence variation confers altered targeting capabilities to miR-204, as assessed by transcriptome analysis. (A–F) Schematic representations of the behavior of predicted targets for either wt-miR-204 (A–C) or mut-miR-204 (D–F) in RNA-Seq experiments carried out in ARPE-19 cells transfected with either wt-miR-204 (A and D) or mut-miR-204 mimics (B and E). (A, B, D, and E) X axis, expression fold changes (on a log2 scale) versus control ARPE-19 cells (i.e., negative mimic transfected). Y axis, statistical significance of expression changes represented as false discovery rate values on a log10 scale. The black horizontal line indicates a false discovery rate of 0.05, and the black vertical lines indicate the 10% expression fold change thresholds chosen to identify genes showing significant expression changes. The blue vertical lines mark the 50% expression fold change value. Red dots indicate the genes that show statistically significant up-regulation in each experiment. Green dots indicate the genes that show statistically significant down-regulation in each experiment. Gray dots represent genes that do not display significant expression changes. Black dots in A and B represent genes that are predicted to be targets of the wt-miR-204, whereas in D and E, they represent genes that are predicted to be targets of the mut-miR-204; that is, carrying the n.37C > T variation. Wt-miR-204–specific predicted targets are significantly more enriched in the genes down-regulated in cells transfected with wt mimics (A) than in genes down-regulated in cells transfected with mut mimics (B), as quantified in the graph shown in C (*P < 0.0001). Conversely, mut-miR-204–specific predicted targets are significantly more enriched in the genes down-regulated (DR) in cells transfected with mut-mimics (E) than in the genes down-regulated in cells transfected with wt-mimics (D), as quantified in the graph shown in F (*P <0.0001).

