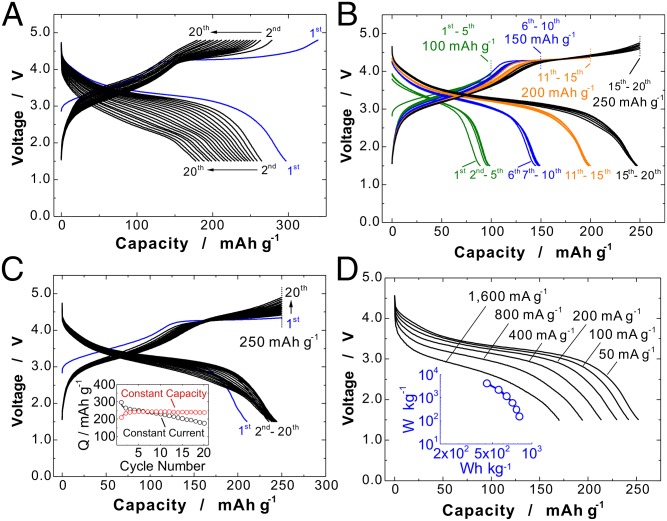
Fig. 5.
Electrode performance of modified Li1.3Nb0.3Mn0.4O2 in Li cells at 50 °C. (A) Galvanostatic charge/discharge curves in the range of 1.5–4.8 V, initial cycle at a rate of 10 mA⋅g-1 and cycles 2–20 at a rate of 25 mA⋅g-1. (B) Charge/discharge curves with constant charge capacity (100, 150, 200, and 250 mAh⋅g−1). (C) Charge/discharge curves with constant charge capacity of 250 mAh⋅g−1 at a rate of 25 mA⋅g−1. (Inset) Discharge capacity retention with constant current and constant charge capacity (250 mAh⋅g−1) is compared. (D) Rate capability of the sample; the cell was charged to 4.6 V at 50 mA⋅g−1 and held at 4.6 V for 90 min and then discharged to 1.5 V at different rates, 50 mA⋅g−1 to 1.6 A⋅g−1. (Inset) A Ragone plot of the sample. The sample loading used was 2.8 mg⋅cm−2.

