
Fig. S1.
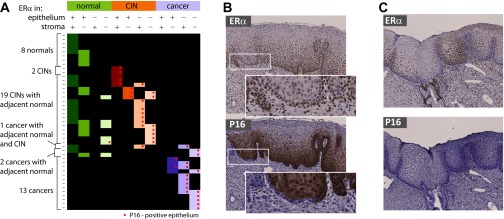
ERα and p16 transitional expression phenotypes. (A) Overview of IHC observations for ERα and p16 from 43 specimens shows distinct local sites of varying levels of disease progression within single sections, accompanied by changes in epithelial distribution of ERα in epithelium and stroma. Cancer progression gravitates toward epithelial loss of ERα expression and increased expression of p16. (B) Example of a specimen with ERα-positive epithelium throughout but with p16 staining progressing from the right-hand side of the image. A single epithelial lobe at the border of p16-negative and p16-positive epithelium shows reduced ERα staining and ERα-positive/p16-negative basal epithelium (Insets). (C) Example of a specimen with distinct convoluted epithelial regions with reduced ERα staining that are nevertheless still negative for p16.