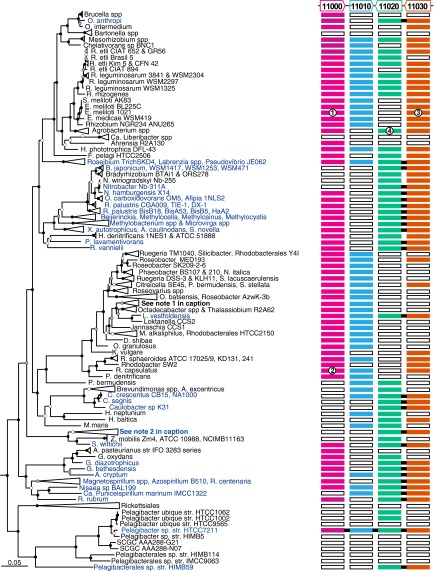
Fig. 1.
Distribution of nonphosphorus lipid synthesis genes in α-proteobacteria. Tree inferred from concatenated 16S/23S rRNA gene sequences. Most monophyletic groups where all members had the same patterns of gene distribution were collapsed. The outgroup taxa can be found in Dataset S1. Node labels represent Shimodaira–Hasegawa confidence test values: black filled, ≥0.9; gray filled, 0.7–0.9; white filled, ≤0.7. Pelagibacter sp. str. HTCC7211 gene orientation is depicted above colored bars; “HTCC7211_000” for each gene identifier has been omitted. The colored bars are a visual representation of Hal clustering results. Bars indicate ortholog presence (filled), absence (open), and chromosomal synteny (black line between bars), or lack of synteny (no black line between bars), for the four genes. Those taxa with adjacent glycosyltransferases and metallophosphoesterases are colored blue in the tree for ease of identification. Numbers inside of colored boxes indicate genes for which functions have been characterized, as follows: 1, SMc01116 (OlsB, E. meliloti); 2, RCAP_rcc02997 (OlsB, R. capsulatus); 3, SMc00171 (phospholipase C, E. meliloti); 4, atu2297 (GADG/MGDG glycosyltransferase, A. fabrum, in collapsed node). Note 1: Sulfitobacter spp., O. indolifex, R. denitrificans and litoralis, Rhodobacterales HTCC2083. Note 2: Erythrobacter HTCC2594/NAP1, and C. bathyomarinum JL354, N. aromaticivorans DSM 12444, Sphingobium spp, Sphingopyxis alaskensis RB2256, Sphingomonas SKA58.

