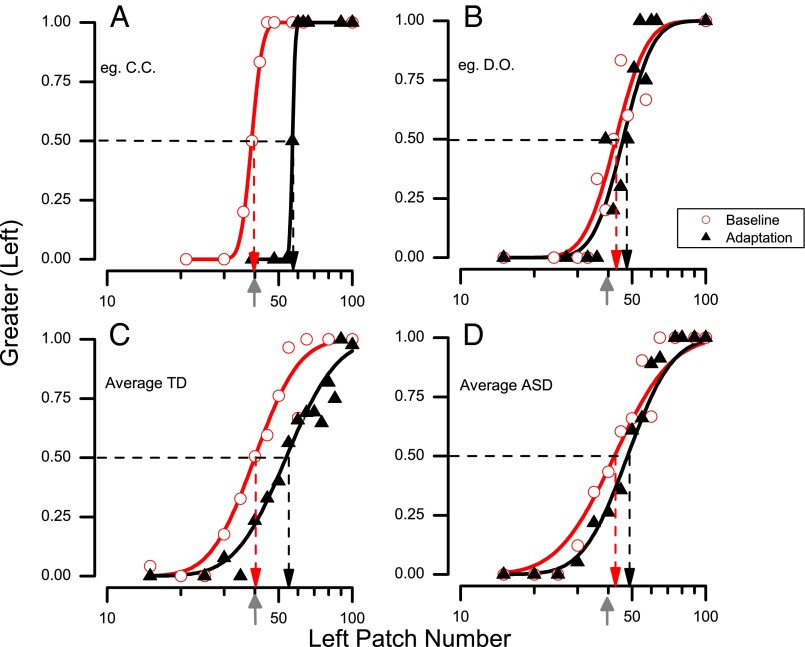
Fig. 2.
Example of psychometric functions, plotting the proportion of trials participants reported the left side as appearing more numerous, as a function of numerosity of the left side (the right side varied inversely by the same proportion, so the geometric mean of the two stimuli equaled the standard 40 dots, indicated by the gray arrows on the abscissae). The vertical dashed lines point to the estimates of the points of subjective equality (PSE), given by the median of the fitted cumulative Gaussian functions. Data in red refer to baseline conditions and those in black to adaptation conditions. (A) Data for a representative typically developing child. (B) Data for a representative child with ASD. (C) All data for the typical group pooled (n = 18). (D) All data for the ASD group pooled (n = 16).

