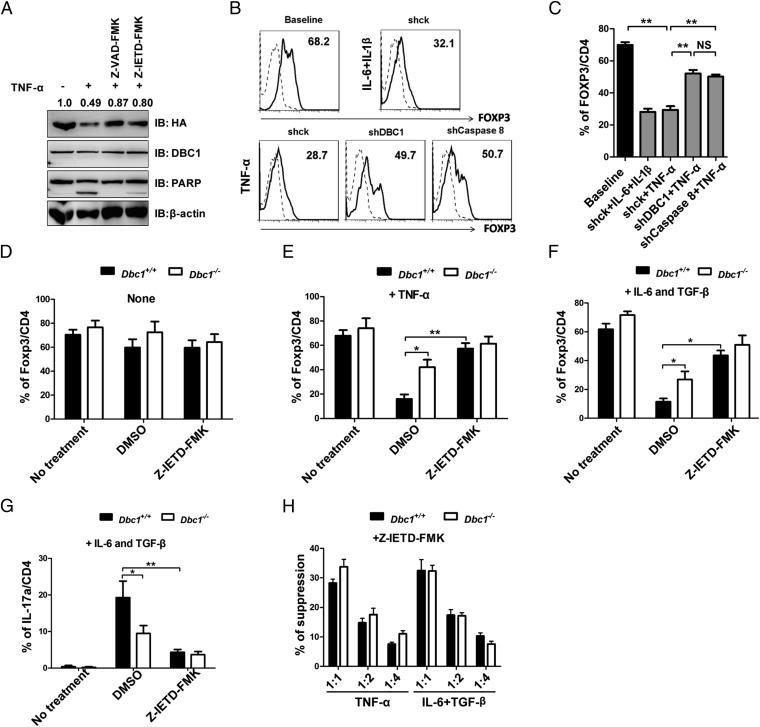
Fig. 5.
Caspase 8 mediates FOXP3 degradation during TNF-α stimulation. (A) Jurkat (HA-FOXP3) cells were stimulated with 5 ng/mL rh-TNF-α for 12 h. The caspase inhibitors Z-VAD-FMK (for pan-caspase) and Z-IETD-FMK (for caspase 8) (10 μM) were used as pretreatment for 1 h. Protein blots were probed with antibodies as indicated. (B) Human Treg cells expanded in vitro for 12 d were infected with lentivirus expressing pLKO.1-shCK-GFP, shDBC1-GFP, or shCaspase 8-GFP. Three days after infection, cells were treated with TCR or with TCR, rh-IL-6 (20 ng/mL) and rh-IL-1β (20 ng/mL) or with TCR and rh-TNF-α (100 ng/mL) for another 3 d. Then FOXP3 expression in the GFP+ population was analyzed by flow cytometry. Dashed lines represent Teff cells, and black lines represent Treg cells. (C) The percentage of FOXP3+ cells in CD4+ cells in the GFP+ population from B was analyzed by flow cytometry. (D) Treg cells obtained from Dbc1+/+ and Dbc1−/− mice were untreated (No treatment) or were pretreated with DMSO or the caspase 8 inhibitor Z-IETD-FMK for 1 h and then were cocultured with rh-IL-2 (200 U/mL) and anti-CD3/CD28 microbeads (1:2 ratio) for 4 d. Cells were harvested, stained for Foxp3/CD25/CD4, and analyzed by flow cytometry. (E) Treg cells were treated and cultured as described in D. Additional rm-TNF-α (100 ng/mL) was added in the culture system. Cells were harvested and stained for Foxp3/CD25/CD4 and analyzed by flow cytometry. (F and G) Treg cells were pretreated and cultured as described in D. rm-IL-6 (10 ng/mL) and rh-TGF-β (5 ng/mL) were added to the culture. Cells were harvested and stained for Foxp3/CD25/CD4 (F) or IL-17a/CD4 (G) and were analyzed by flow cytometry. “No treatment,” without treatment of inflammatory cytokines and inhibitors. (H) Suppressive activity of Treg cells from Dbc1−/− and Dbc1+/+ mice. Treg cells isolated from Dbc1−/− and Dbc1+/+ mice were pretreated with Z-IETD-FMK for 1 h and then were pretreated with 50 ng/mL rm-TNF-α or were treated with 10 ng/mL rm-IL-6 and 5 ng/mL rh-TGF-β. Treg cells’ suppressive function was tested as described in Methods. The x axis shows the ratio of Treg cells to responder T cells. All data are representative of three independent experiments.

