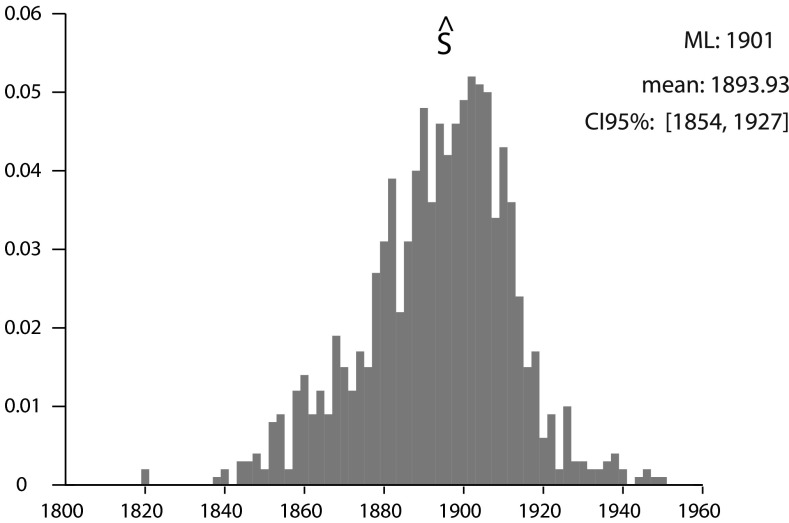
Fig. S3.
Posterior distribution of S. Using a uniform prior between 1800 and 1950, we retrieved the marginal posterior distribution of S using MCMC on the whole data set. The distribution is clearly unimodal and centered around 1900 and gives an estimate of the date when the extinction rate rose suddenly on a worldwide scale.

