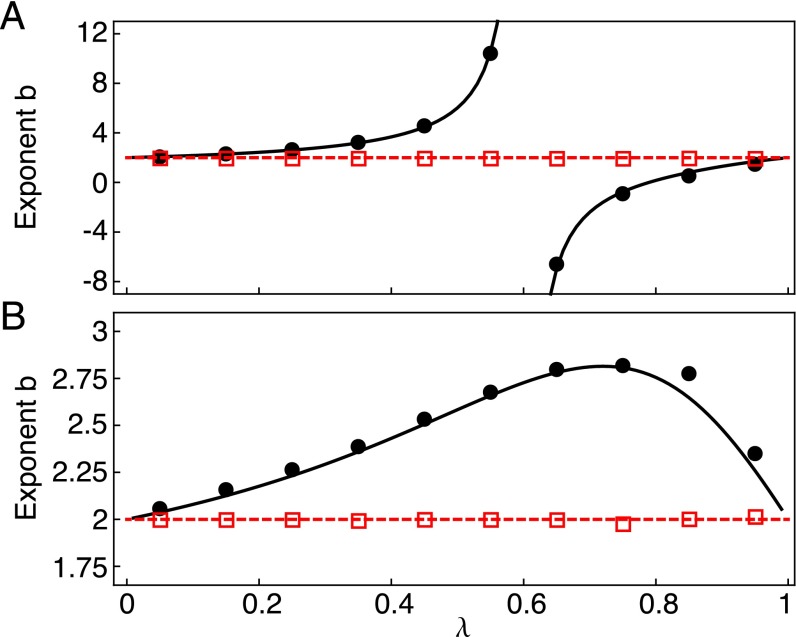
Fig. 1.
TL exponent b for different values of the transition probability λ. The sample exponents computed in R simulations of a two-state multiplicative process with symmetric transition matrix in the two regimes (black solid circles, up to time ) and (red open squares, up to time ) are in good agreement with predictions for the asymptotic population (black solid line, Eq. 9) and sample (red dashed line, ) exponents. In the simulations, the sample exponent b was computed by least-squares fitting of as a function of for the last 6 (black circles) and 200 (red squares) time steps. In A, which has the plotted theoretical result from ref. 24, (b displays a discontinuity); in B, (in such a case, b displays no discontinuity). Fig. S1 shows the generalized TL exponent in the same simulations.

