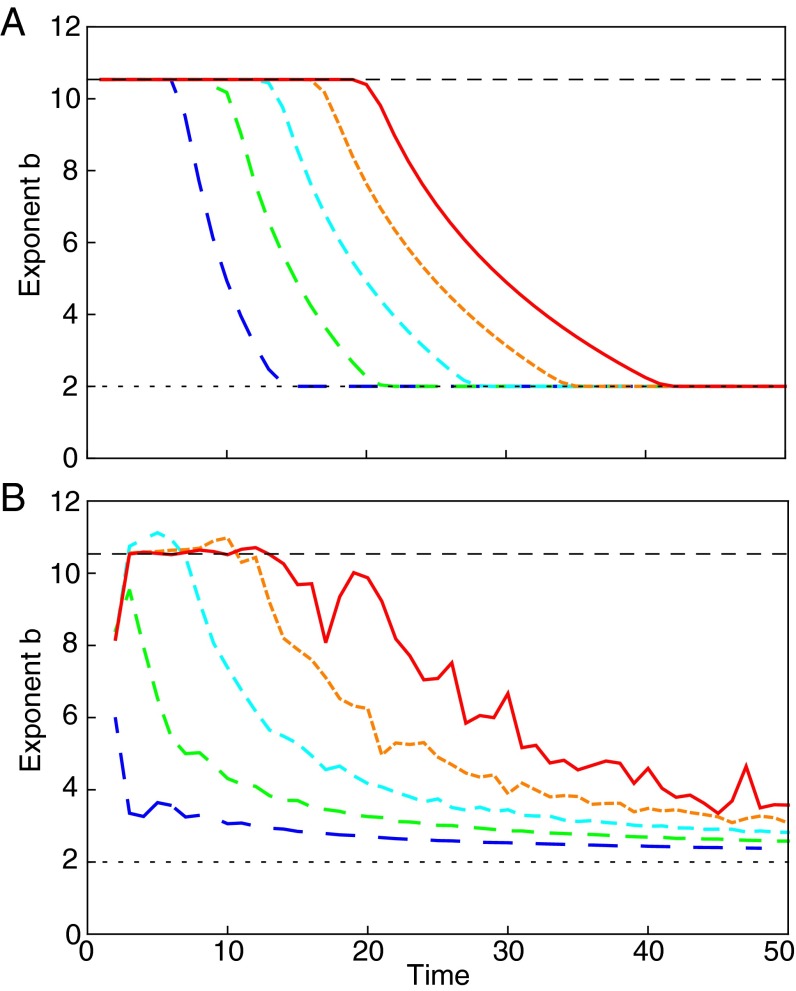
Fig. 2.
Time evolution of the sample TL exponent. The sample exponent {computed as the slope of the curve vs. } crosses over from the approximate population exponent (Eq. 9, dashed upper horizontal line) at small times to (dotted lower horizontal line) at larger times. The number of simulations increases exponentially from (blue dashed lines) to (red solid lines), whereas the crossover time increases approximately linearly. Here, and the transition probability (with symmetric) is . (A) Theoretical prediction computed via Eq. 15. (B) Simulation results. Curves are averaged over simulations (except for the blue curve, averaged over simulations). Mismatches between A and B are due to the necessity to have t and R not too large to keep simulations feasible, whereas Eqs. 8 and 13 hold true asymptotically in t.

