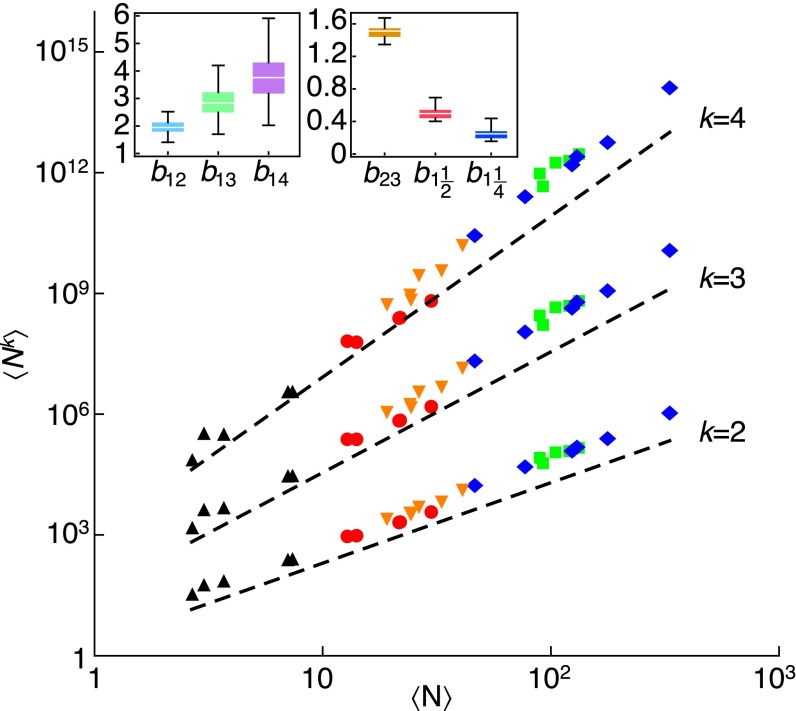
Fig. 3.
Generalized TL for intraspecific patterns of carabid beetles abundance. Shown is a double logarithmic plot of vs. for different species (identified by different colors and symbols), for consecutive years (each symbol refers to a single year t). For visual clarity, only five species are shown. Dashed black lines of slopes (asymptotic model prediction) are shown. Vertical offsets are introduced to aid comparison of slopes. (Insets) Box and whisker plots for the empirical distribution of intraspecific generalized TL exponents , showing the median (white horizontal line) and the and quantiles.

