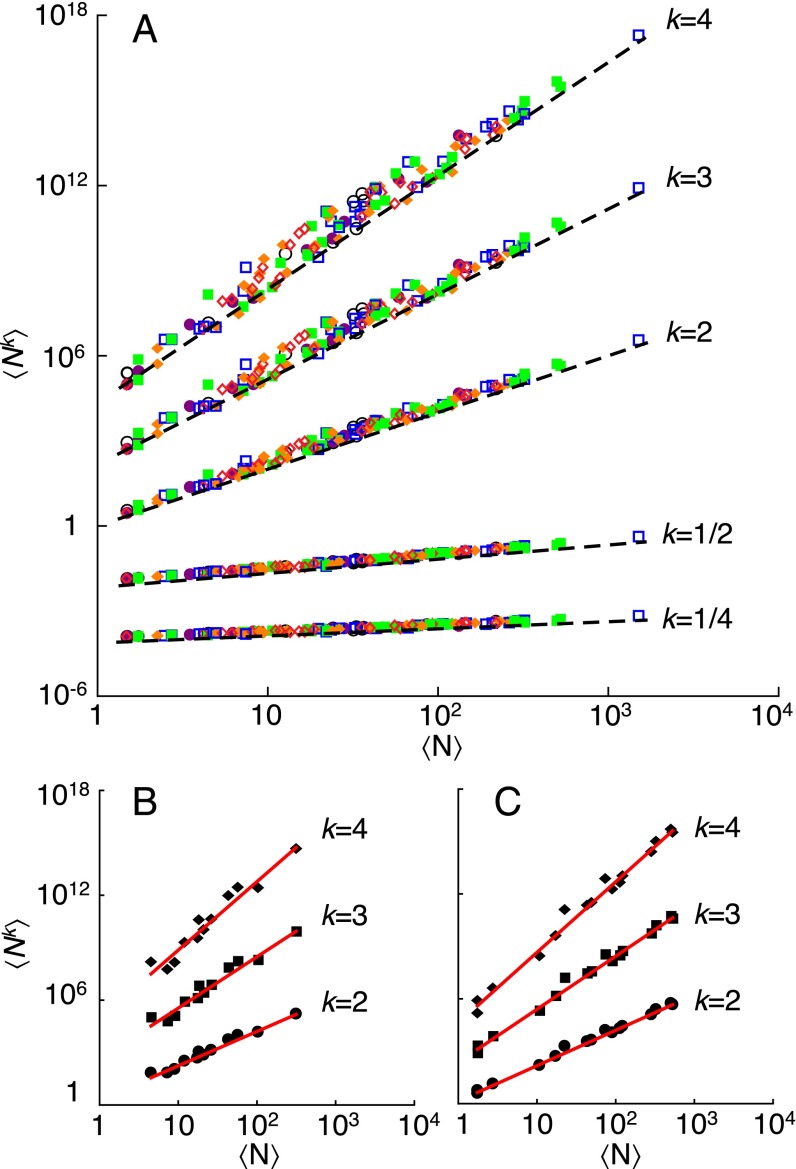
Fig. 4.
Generalized TL for interspecific patterns of abundance of carabid beetles. (A) Double logarithmic plot of vs. for all species, years, and site types. Each data point refers to a single species in 1 y and site type. The color and symbol code identifies data relative to the same year: 1961 (black open circles), 1962 (purple solid circles), 1963 (blue open squares), 1964 (green solid squares), 1965 (orange solid diamonds), and 1966 (red open diamonds). Dashed black lines of slope (asymptotic model prediction) are plotted next to the corresponding data series. Vertical offsets are introduced to aid comparison of slopes. (B and C) Examples of interspecific moments scaling (each data point refers to a single species) for a single year and site type (B, woodland 1964; C, heath 1964) used for the statistical analysis (SI Methods, Table 2, Tables S1 and S2, and Fig. S5). The red lines are the least-squares regressions of vs. across species.

