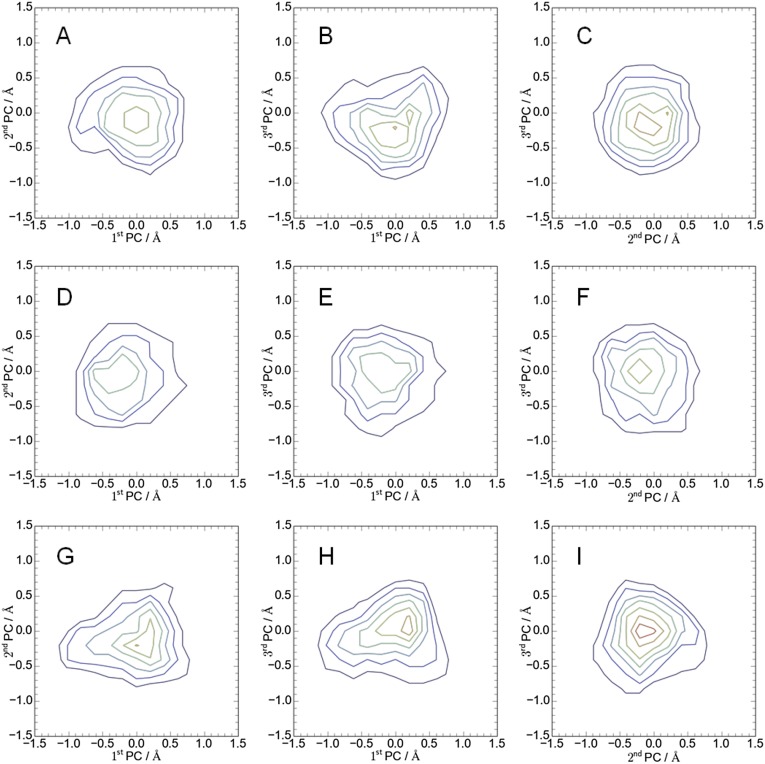
Fig. S4.
Principal component analysis of the 25-ns MD simulation in vacuo (initial modeling). Projections of conformational ensembles were calculated from the trajectory with group 3 (A–C), group 5 (D–F), and group 6 (G–I). The x and y values represent the deviation from the average structure along the principal axes. Contour lines in purple, blue, cyan, green, yellow, orange, and red indicate values of probability density, 0.2, 0.3, 0.4, 0.5, 0.6, 0.7, and 0.8, respectively.

