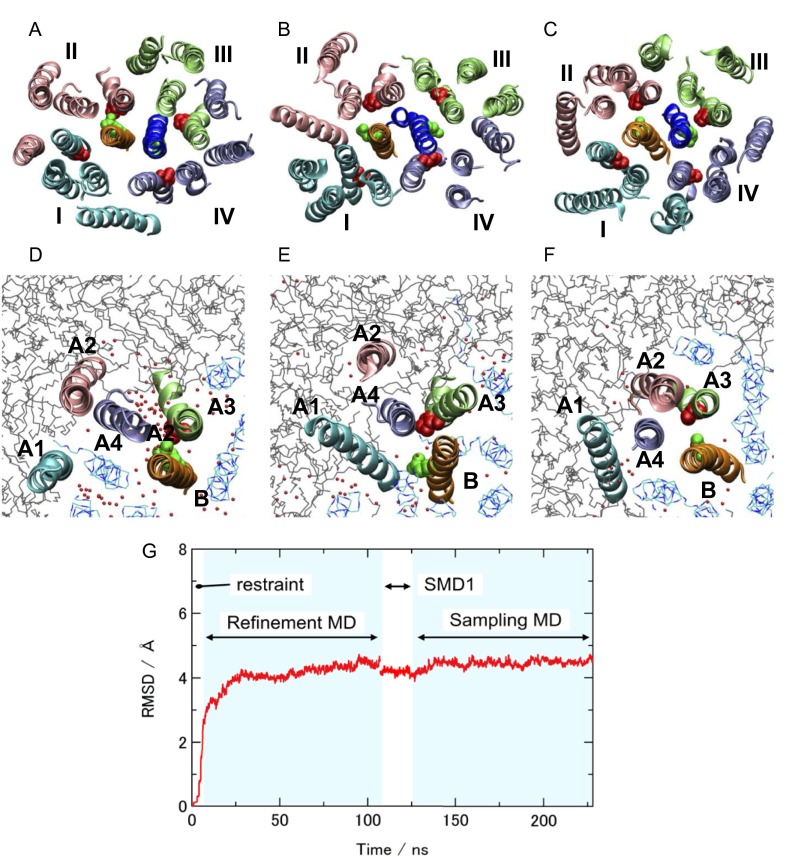
Fig. S7.
Overall structures during the all-atom MD in membrane and solution (refinement MD). A–C are viewed from the periplasmic side. Two MotB proteins are shown by orange and blue, and four MotA subunits are represented by cyan (I), pink (II), lime (III), and purple (IV) (see also Fig. S2 for MotA subunit labels, I−IV). Asp32 on B (green) and Pro173 on A3 (red) were represented by vdW spheres. D–F show A1 (cyan), A2 (pink), A3 (lime), and A4 (purple) on the MotA subunit II, and B (orange). Gray lines indicate lipid molecules. Blue lines show the MotA TM segments that do not form the channel. (A and D) Group 3, (B and E) group 5, and (C and F) group 6. Small red dots and gray wire model represent oxygen atoms of water molecules in the membrane region and the lipids, respectively. (G) The root-mean-square deviation (RMSD) from the best snapshot in the initial modeling during the 6-ns decreasing restraint MD, the 100-ns refinement MD without the restraints, 20-ns SMD1, and 100-ns sampling MD.

