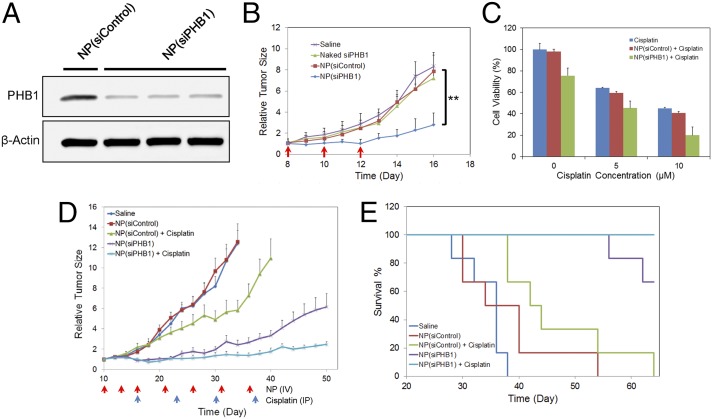
Fig. 4.
In vivo validation of PHB1-targeted NSCLC therapy. (A) Representative Western blot analysis of PHB1 expression in NCI-H460 tumor tissue after systemic NP treatment. (B) Therapeutic efficacy of NP(siPHB1) in NCI-H460 xenograft [n = 4 per group; **P < 0.01 vs. NP(siControl)]. Three i.v. injections are indicated by the arrows. (C) In vitro cytotoxicity of NP(siPHB1) in combination with free cisplatin in A549 cells. (D) Inhibition of A549 tumor growth after combinatorial treatment with NP(siPHB1) and cisplatin. The arrows indicate the timeline for i.v. injection of NP(siPHB1) (red) and i.p. injection of cisplatin (blue). Data are shown as the mean ± SEM (n = 6 per group). (E) The Kaplan–Meier survival curve of the cohorts in D.

