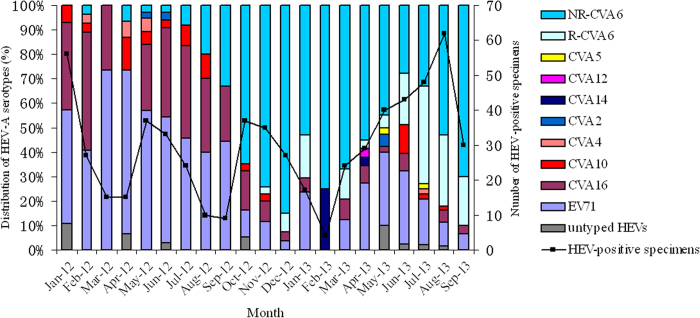
Figure 1. Monthly distribution of EV-A in Shanghai, China, from January 2012 to September 2013.
The continuous line describes the total number of specimens collected each month in Shanghai; the histogram depicts the distribution of recombinant CVA6 (R-CVA6), non-recombinant CVA6 (NR-CVA6) and other EV-A serotypes identified each month.

