
Figure 2. Spongiform lesion profiles in primates infected with various TSEs.
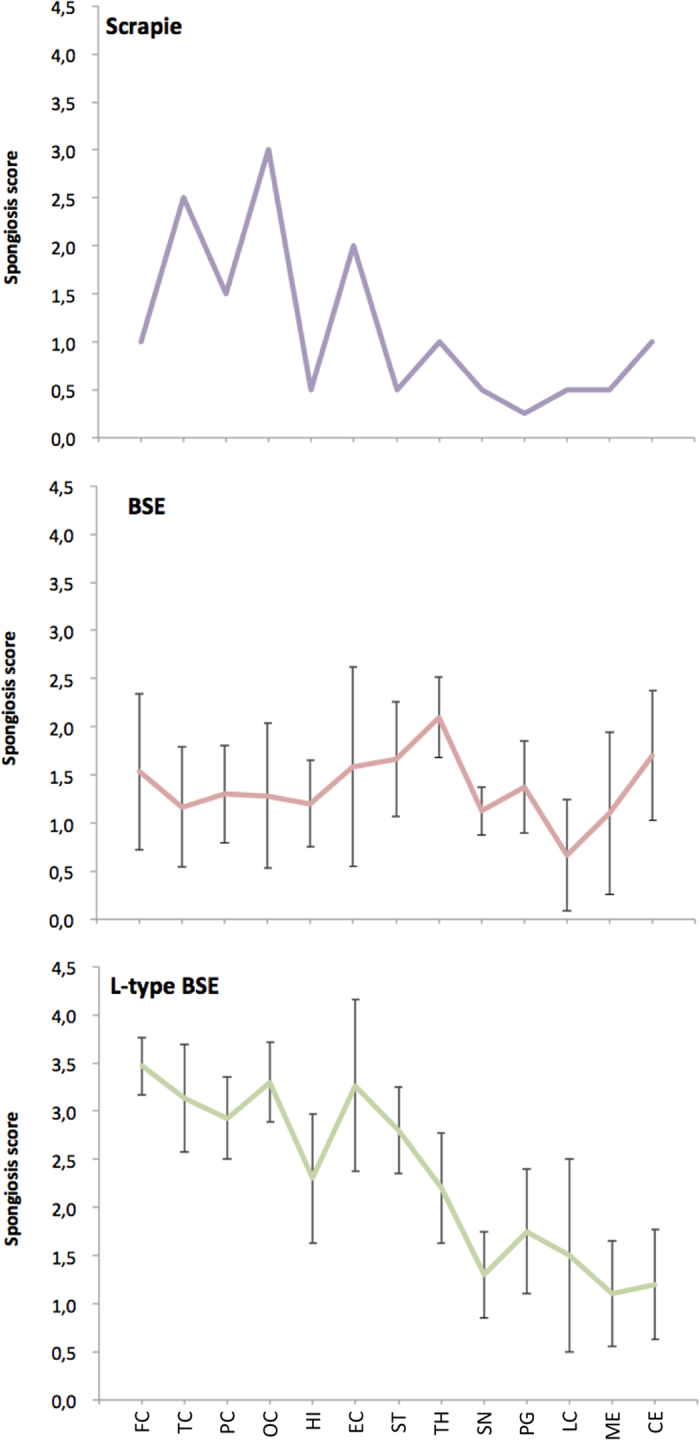
Lesion profiles in primates exposed to scrapie (A) BSE (B) or L-type BSE (C) were defined according to the scoring and areas described by Parchi et al.29. The lesion profile of c-BSE- and L-type BSE-infected primates is depicted as the mean among 5 and 4 primates exposed to c-BSE or L-type BSE, respectively.