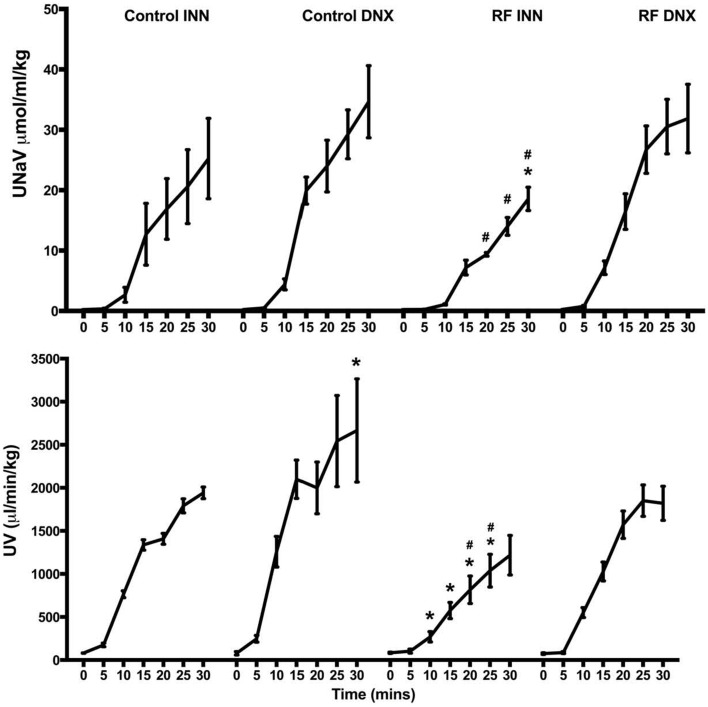
Figure 8.
This presents the values of urine flow (UV) and sodium excretion (UNaV) for each of the 5 min periods during the 30 min of saline volume expansion in control, control renally denervated rats (control DNX), cisplatin treated renal failure (RF) and renally denervated renal failure (RF DNX) groups of rats. Statistical analysis was performed using Two-Way ANOVA followed by Tukey's post hoc test. Data presented as mean SEM. (n = 12 for all groups). *P < 0.01 vs. control #P < 0.05 vs. RF DNX. P-value for interaction is <0.001.

