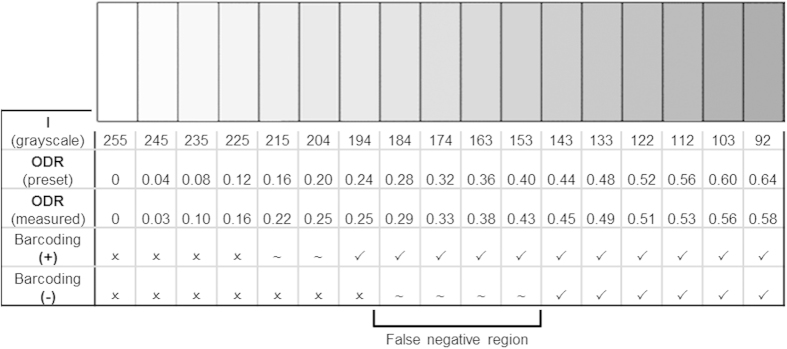
Figure 2. Correlation between the preset grayscale values, the preset ODR, the measured ODR, and the reading capability by the barcode app.

The test and control lines (Fig. 1b, the four differential elements) were printed at the preset grayscale values and scanned to determine whether the barcode app could read the result; the remaining bars of the barcode (start, stop, and other elements of the “+” and “−” characters) are printed in black (I = 0).
