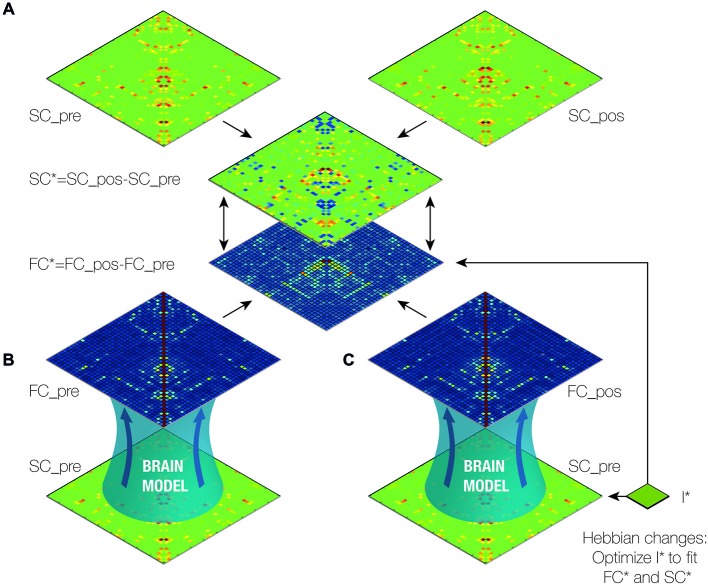
Figure 2.
Outline of brain model analysis and optimization. (A) First, we created the difference (SC*) between the pre- and post-operative structural connectivity (SC) matrices (SC_pos-SC_pre; see Figure 1) (van Hartevelt et al., 2014). (B) The functional connectivity matrix (FC_pre) was generated with a dynamic mean-field (DMF) model using SC_pre. (C) We then iteratively generated the functional connectivity post-DBS (FC_pos) using the computational model with SC_pre and the I*, the weights of the known connections from the STN. We subsequently optimized I* such that the difference between FC_pre and FC_pos (FC*) was made to fit SC*. In this way, we estimated the optimal working weights from the STN. Finally, we calculated the contribution of each of the connections from the STN to the changes in functional connectivity caused by DBS by varying the weights of each of the connections and measuring the impact on the fit (see Figure 3).

