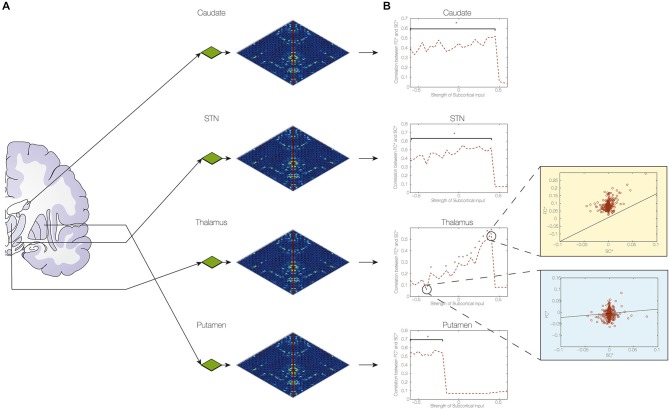
Figure 3.
Determining the contribution of subcortical connections of STN. (A) We found the optimum fit of I* and then varied each of the model parameters of the connections from the STN to the putamen, caudate, thalamus and STN itself to estimate their contributions to the changes in functional connectivity caused by DBS. Compared to no DBS, the optimum fit was highly significant (p < 10–7). (B) The figure clearly demonstrates the importance of the changes in connectivity weights to the thalamus and the putamen with the consequences of the best fit in thalamic connectivity shown in top right (light yellow) and poorest fit shown in bottom right (light blue) (with a star indicating significance levels of p < 0.05).

