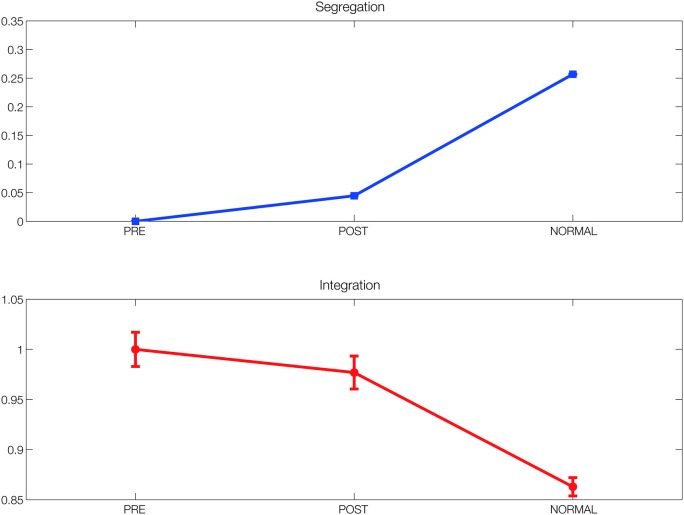
Figure 4.
Segregation and integration. Segregation and integration measures in the simulated functional networks before and after DBS (FC_pre and FC_pos) compared to the ones found in the simulated functional network obtained using the connectivity from the healthy population (FC_normal). Both measures improved after 5 months of DBS, although not to the level found in the normal population.

