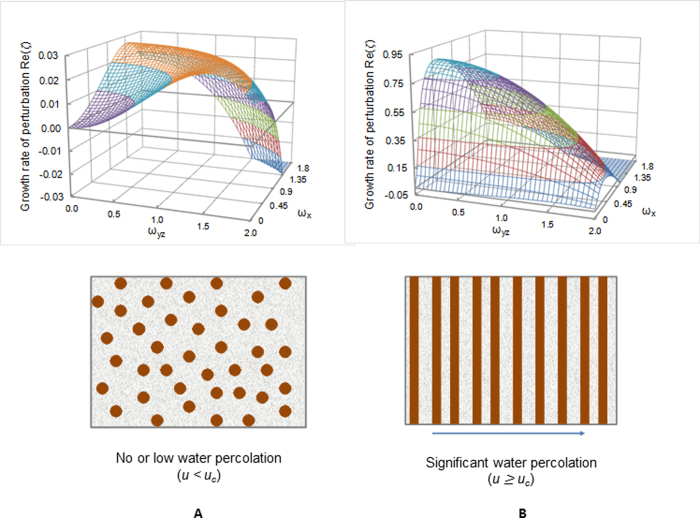
Figure 3. Emergence of iron oxide cementation patterns predicted from a linear stability analysis.
The wave number with the maximum growth rate (ωmax) determines the geometry and scale of the emerging pattern. Groundwater is assumed to percolate along the x-direction. ωx is the wave number in the direction parallel to the groundwater flow and ωyz is the wave number in the direction perpendicular to the flow. In a case with no significant flow present, the growth rate of perturbation has equal maxima on both ωx and ωyz; therefore a precipitation pattern forms – i.e., spots or nodules – with no directional preference (A). But for significant or dominant water flow, the growth rate of perturbation displays a maximum only at ωyz = 0; consequently a pattern forms only along the flow path, while patterns along the direction normal to the flow direction are suppressed (B) since ωmax,yz = 0, as illustrated schematically in the lower panel. α = 0.013, φs = 0.15, θ = 1.0, η = − 1.0, β = 0.2, m = 2, and u = 0 (left) or 6 (>uc ≈ 1) (right).

