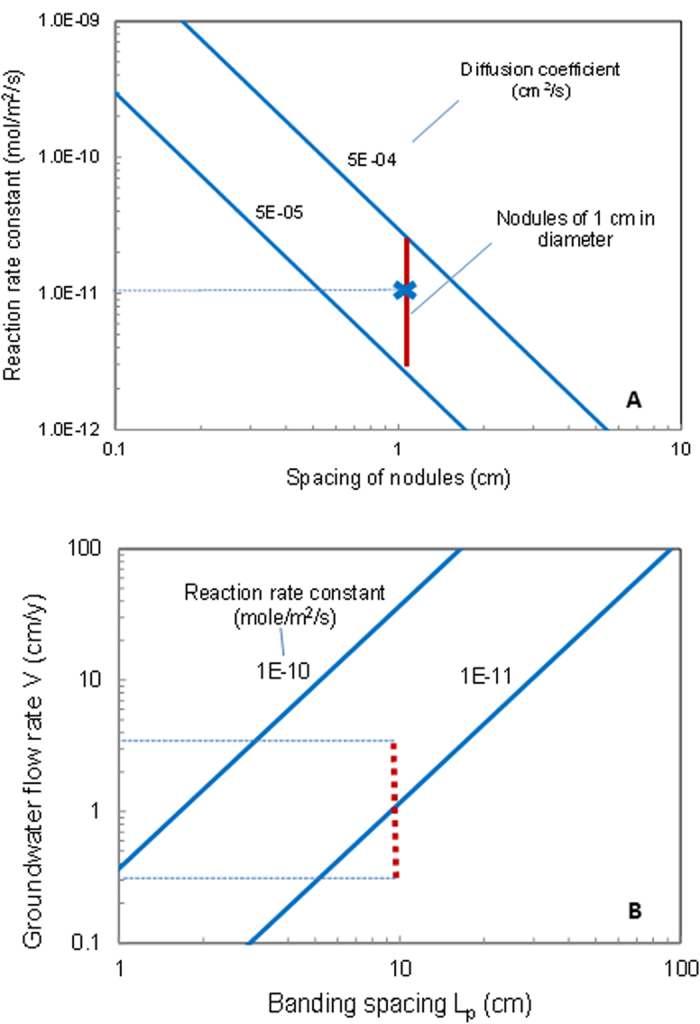
Figure 5. Estimation of key chemical and hydrologic parameters from iron oxide cementation patterns.

The rate constant for iron oxide precipitation can be estimated from the spacing of nodules using Equation (12) (A). Symbol x is the laboratory measurement of hematite dissolution rate39. For a given reaction rate constant, the groundwater flow rate can be estimated from the spacing of iron oxide bands using Equation (13) (B). Note that Equation (13) is valid only for relatively large flow rates. Vertical bars indicate the ranges of reaction rate constant and groundwater flow rate estimated from pattern sizes. φs = 0.15,  = 5 × 10⁻¹⁰ mole/cm3 solution,
  = 10−11 mole/m2/s, Q0 = 10−3 mole/cm3 bulk sediment,
  = 0.2 m2/cm3 bulk sediment, β = 0.2, and D0 = 510−5 cm2/s (B).
