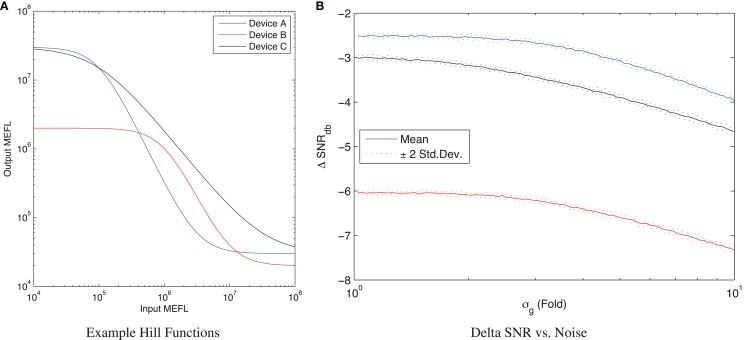
Figure 2.
The input/output curve of a device can be used to analyze its ΔSNRdB. (A) Three example input/output curves, Device A (blue) is stronger than Device B (red) and also has more similar input and output ranges, while Device C (black) has a similar range to Device A but flatter slope. (B) For any given input levels, the observed ΔSNRdB depends on the amount of noise σg, converging to a maximum at low noise and falling as the noise increases.

