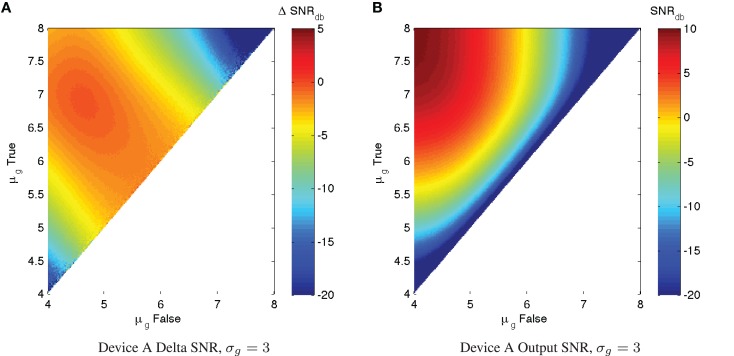
Figure 4.
With significant expression noise, ΔSNRdB may be significantly worse than under ideal conditions. For example, the charts above present the same analysis of Device A as in Figure 3, (A) shows ΔSNRdB, (B) shows output SNRdB, but with a more typical σg = 3 level of expression noise. Note that the color scales are truncated at the lower end to provide better resolution in the upper range.

