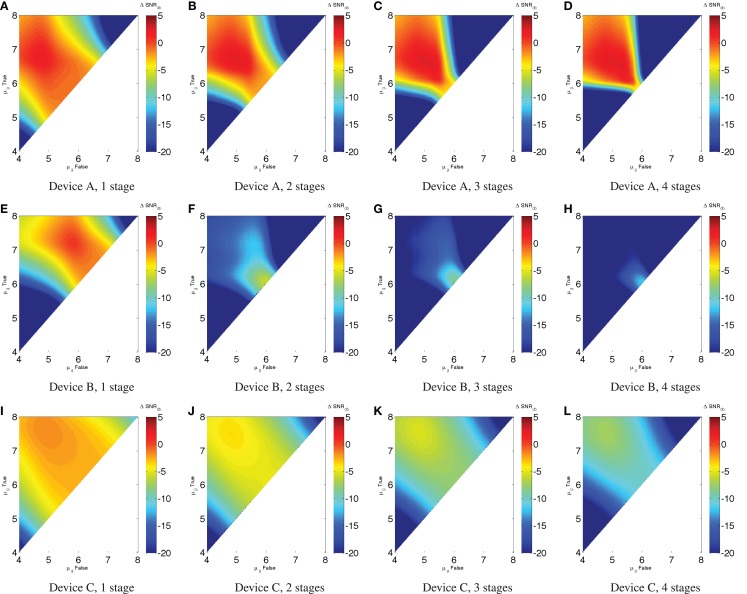
Figure 5.
Low noise ΔSNRdB in a chain of inverters: (A–D) show chains of one to four Device A elements, (E–H) show chains of Device B elements, and (I–L) show chains of Device C elements. Notice that for Device A there is a range of widely separated inputs (approximately μg,false < 105.5, μg,true > 106), where it is possible for SNR to remain strong; Device B is weaker and less well matched between input and output, and thus any computation with more than a single element has a badly degraded signal strength for all possible inputs. Device C, on the other hand, degrades incrementally in SNR across a broad range. Note that the color scales are truncated at the lower end to provide better resolution in the upper range.

