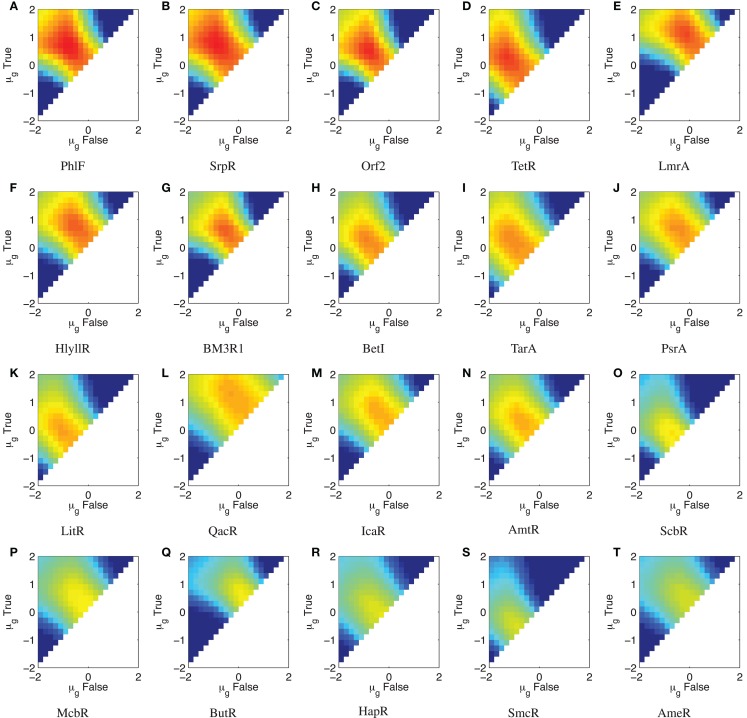
Figure 7.
Parameter scan of ΔSNRdB for the TetR homolog library from Stanton et al. (2014) with σg = 2.0, sorted by maximum ΔSNRdB. (A–T) show ΔSNRdB for each device in the library, sorted in descending order of maximum ΔSNRdB. Colors use the same range as previously, from −20 to 5 dB. Note that the color scales are truncated at the lower end to provide better resolution in the upper range.

