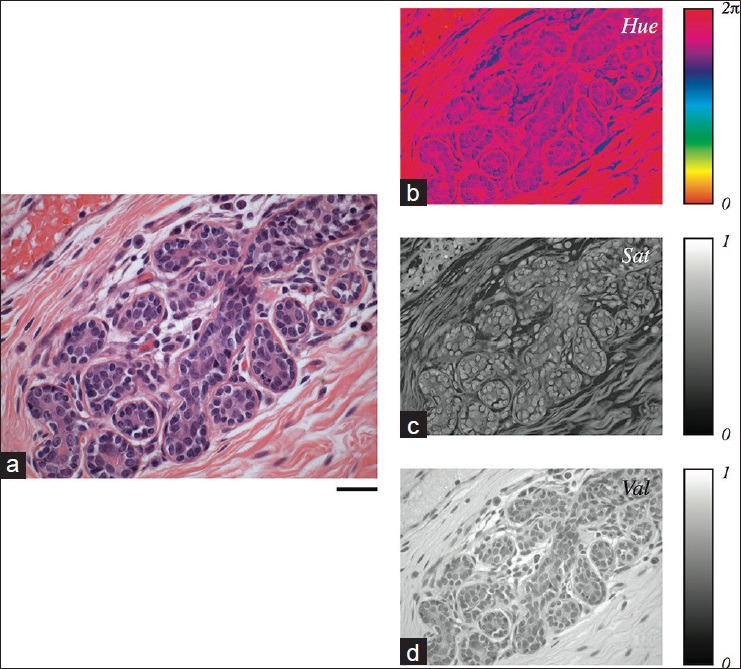
Figure 1.

Hue, saturation, and value representation of a representative hematoxylin and eosin stained image. (a) A digital image of a normal breast lobular unit, showing distinct nuclear, cytoplasmic, and stromal regions. Scale bar: 50 μm. The hue (b), saturation (c), and value (d) components of the image shown in (a) are depicted
