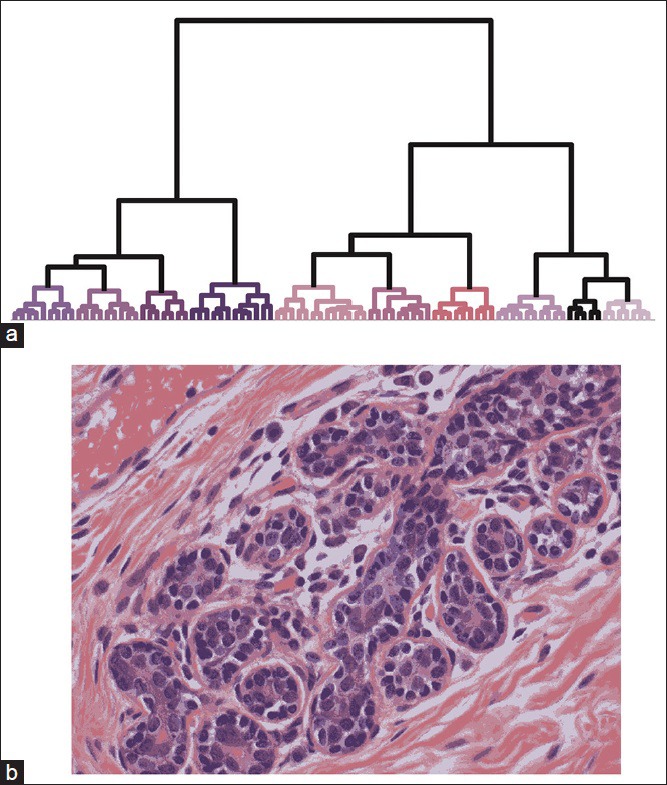
Figure 2.

Color reduction for user characterization. (a) Hierarchical clustering of the pixels in Figure 2a produced 10 clusters, each represented by a different color in the dendrogram. Colors matched the cluster's centroid, except for lumen which is designated black for clarity. The heights of the connecting links in the dendrogram represent the dissimilarity between two clusters. For clarity, only the top of the dendrogram is shown and therefore nodes corresponding to single pixels are not visible. (b) A pseudocolor representation was formed by assigning each pixel to one of the clusters shown in (a)
