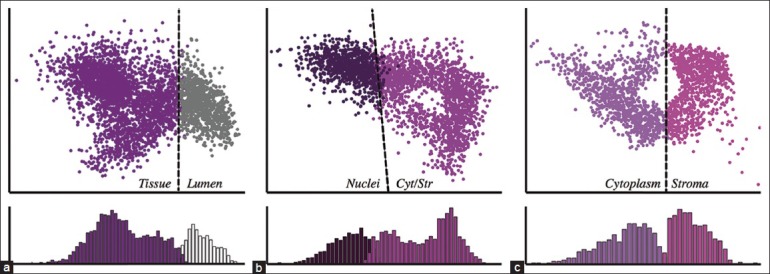
Figure 4.

Support vector machine (SVM) classifiers derived from a single H&E stained image. SVM classifiers were computed from a ground truth supplied by the user in a serial fashion shown schematically in Figure 3. Hyperplanes are denoted by dashed lines. For clarity, data points are rotated in HSV space and projected into two dimensions so that the hyperplane extends out of the page. Histograms in the bottom panels represent the projection of points normal to the hyperplane and therefore represent the distribution of distances to the hyperplane. (a) Tissue versus lumen. (b) Nuclei versus cytoplasm and stroma. (c) Cytoplasm versus stroma
