
Figure 7.
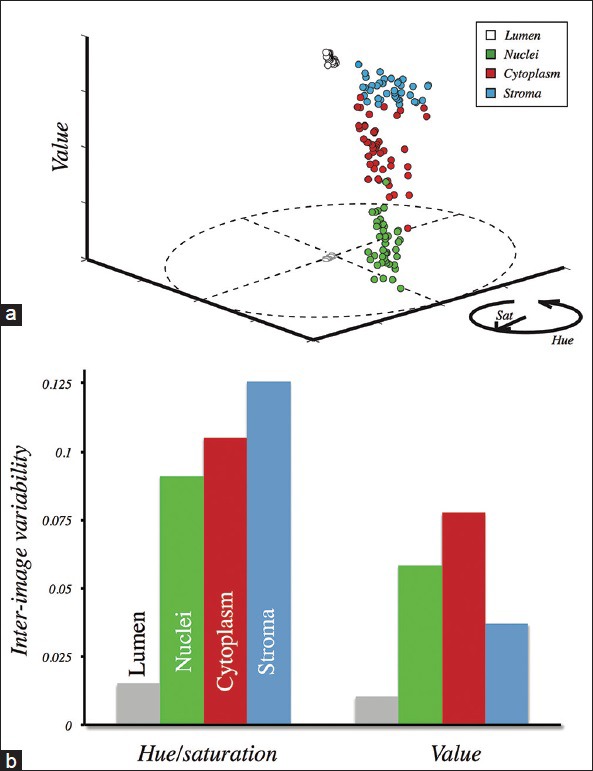
Inter-image variability. (a) Cluster centroids for each structure in each analyzed image are plotted in HSV space. Points representing lumen are also shown projected to the hue-saturation plane to demonstrate that they consistently congregate about (0, 0). (b) The variability across images was computed within the hue-saturation plane (left) and the value axis (right). Stroma varied most strongly in the hue-saturation plane relative to the other structures