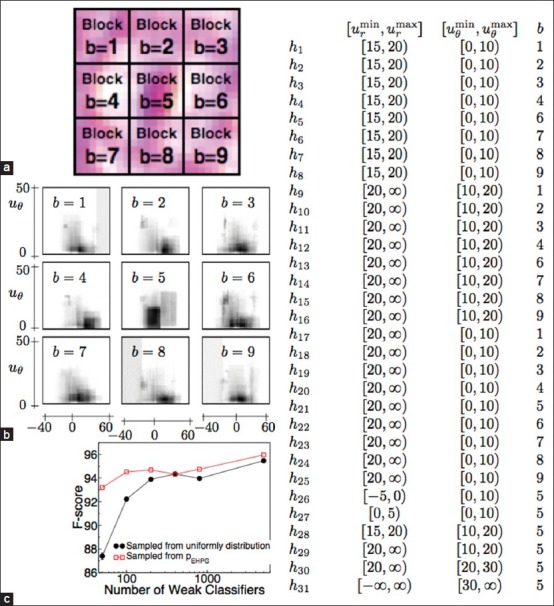
Figure 1.

(a) How the s × s pixels image patch is divided into blocks. (b) The plot of pEHPG (ur, uθ, b) for each block. x-axis represents ur and y-axis represents uθ. Dark areas represent areas of high probabilities. Notice that windows around ur ≈ 0 and uθ ≈0 at block b = 5 are sampled at high frequency. (c) That F-score for classification increases with the use of pEHPG for sampling windows wi. The right table shows the ranges of ur, uθ and b values in which histogram counts are accumulated for HPG features
